
VANCOUVER, BC / ACCESSWIRE / December 18, 2023 / Aton Resources Inc. (TSX-V:AAN) ("Aton" or the "Company") is pleased to update investors with the final results from its reverse circulation percussion ("RC") drilling at the Semna gold mine prospect, located within its 100% owned Abu Marawat Concession ("Abu Marawat" or the "Concession"), in the Eastern Desert of Egypt.
Highlights:
- 21 holes were drilled at the Semna prospect, for a total of 3,662m, with the preliminary drill results from 4m composite sampling having previously been reported (see news releases dated October 13, 2023 and November 7, 2023);
- Assay results of the primary 1m split samples through the mineralised zones are now available, and show good correlation with the 4m composite sampling;
- Significant high grade mineralised intersections from the Semna Main Vein zone ("SMV") include:
- 50.07 g/t Au over a 6m interval, from 75m downhole depth (hole SMP-016), including 222 g/t Au over 1m, from 80m;
- 28.36 g/t Au, 28.4 g/t Ag and 1.15% Cu over a 4m interval, from 136m downhole depth (hole SMP-003), including 94.8 g/t Au, 88.2 g/t Ag and 3.47% Cu over 1m, from 137m;
- 11.98 g/t Au over a 16m interval, from 61m downhole depth (hole SMP-018), including 36.03 g/t Au over 4m, from 61m;
- 10.61 g/t Au, 24.0 g/t Ag and 1.20% Cu over a 9m interval, from 130m downhole depth (hole SMP-019), including 37.00 g/t Au, 145.0 g/t Ag and 8.72% Cu over 1m, from 133m. SMP-019 also returned intersections of 5.82 g/t Au over a 3m interval from 102m, and 9.10 g/t Au over a 2m interval from 111m.
- 5.73 g/t Au over a 14m interval, from 56m downhole depth (hole SMP-017), including 14.85 g/t Au over 3m from 60m, and 8.67 g/t Au over 3m from 66m.
"We are pleased to be able to now provide the final assay results from the Semna RC drilling programme. It is quite apparent to us, even at this early stage, that Semna is shaping up as a very significant new drill discovery. We plan to fast-track the exploration at Semna as soon as the mining licence has been issued at Abu Marawat, which we anticipate will be very soon now. Preparations are already well advanced to start a second phase of diamond drilling, and if all goes according to plan we expect to be back drilling again at Semna in January 2024." said Tonno Vahk, Interim CEO. "We started this year with the overriding objective of completing our submission to EMRA, to demonstrate the existence of a Commercial Discovery at the Hamama West and Rodruin deposits, which under the terms of our Concession Agreement with EMRA, is the most significant step on the road to the mining licence at Abu Marawat. We delivered our submission to EMRA in August, we believe that we are now very nearly there, and we are looking forward to working closely with EMRA as we move forwards together once the mining licence has been issued. 2023 has been a year of great progress for Aton, and we close the year with these exceptional drill results from our new Semna discovery. These results again further illustrate the undoubted potential of the Abu Marawat Concession to host multiple economic gold deposits. With the anticipated issuance of the mining licence we look forward to being able to finally start realising the full potential of the Concession, as we move towards the development of multiple gold mining operations at Abu Marawat, starting in 2024."
Semna Prospect
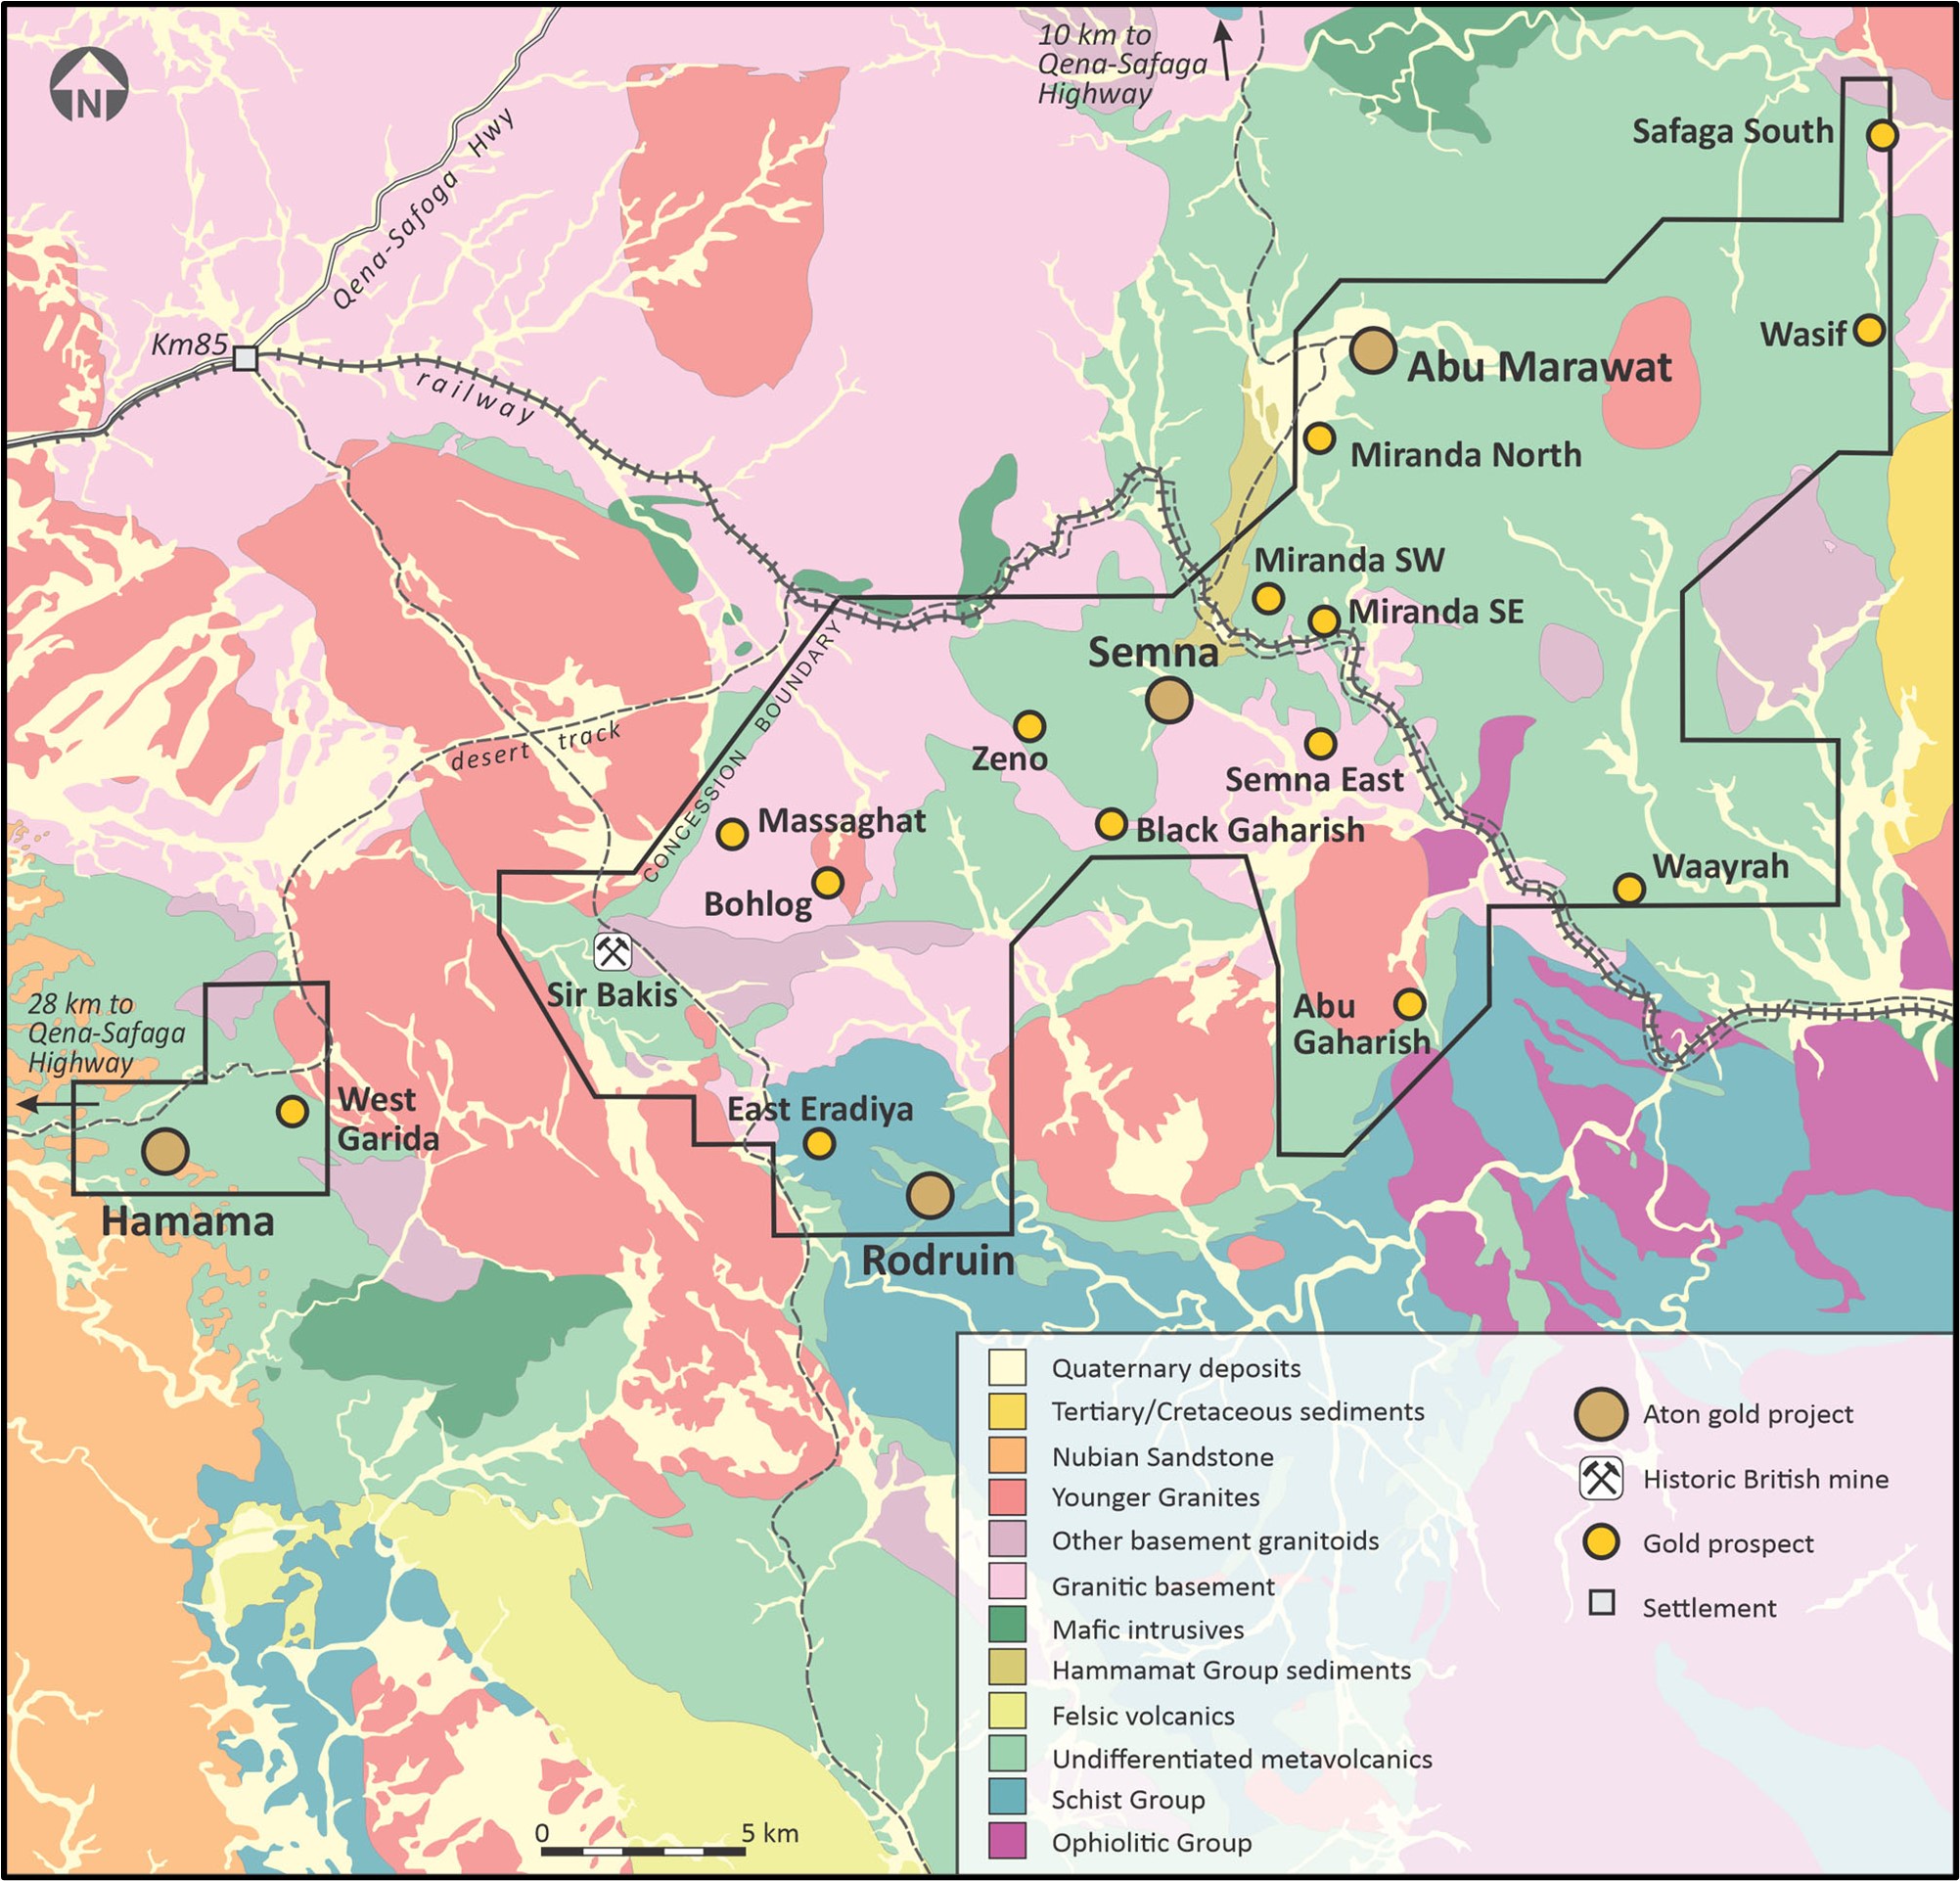
The Semna prospect is located approximately 27km east-northeast of the Hamama West deposit and 13km north-northeast of the Rodruin deposit, and is accessed via desert tracks from either Hamama, Rodruin or the Abu Marawat deposit to the north (Figure 1). The Semna area has a long history of gold mining, during both ancient and modern times. Archaeological evidence suggests that mining dates back as far as the Old Kingdom period, over 4,500 years ago. In modern times, Semna was exploited between 1904 and 1906 by two British companies, which worked the Main Vein on two underground levels. There was also some further development work carried out at Semna in the 1950's by a subsidiary of the Egyptian Phosphate Company.
Semna gold mine RC drilling
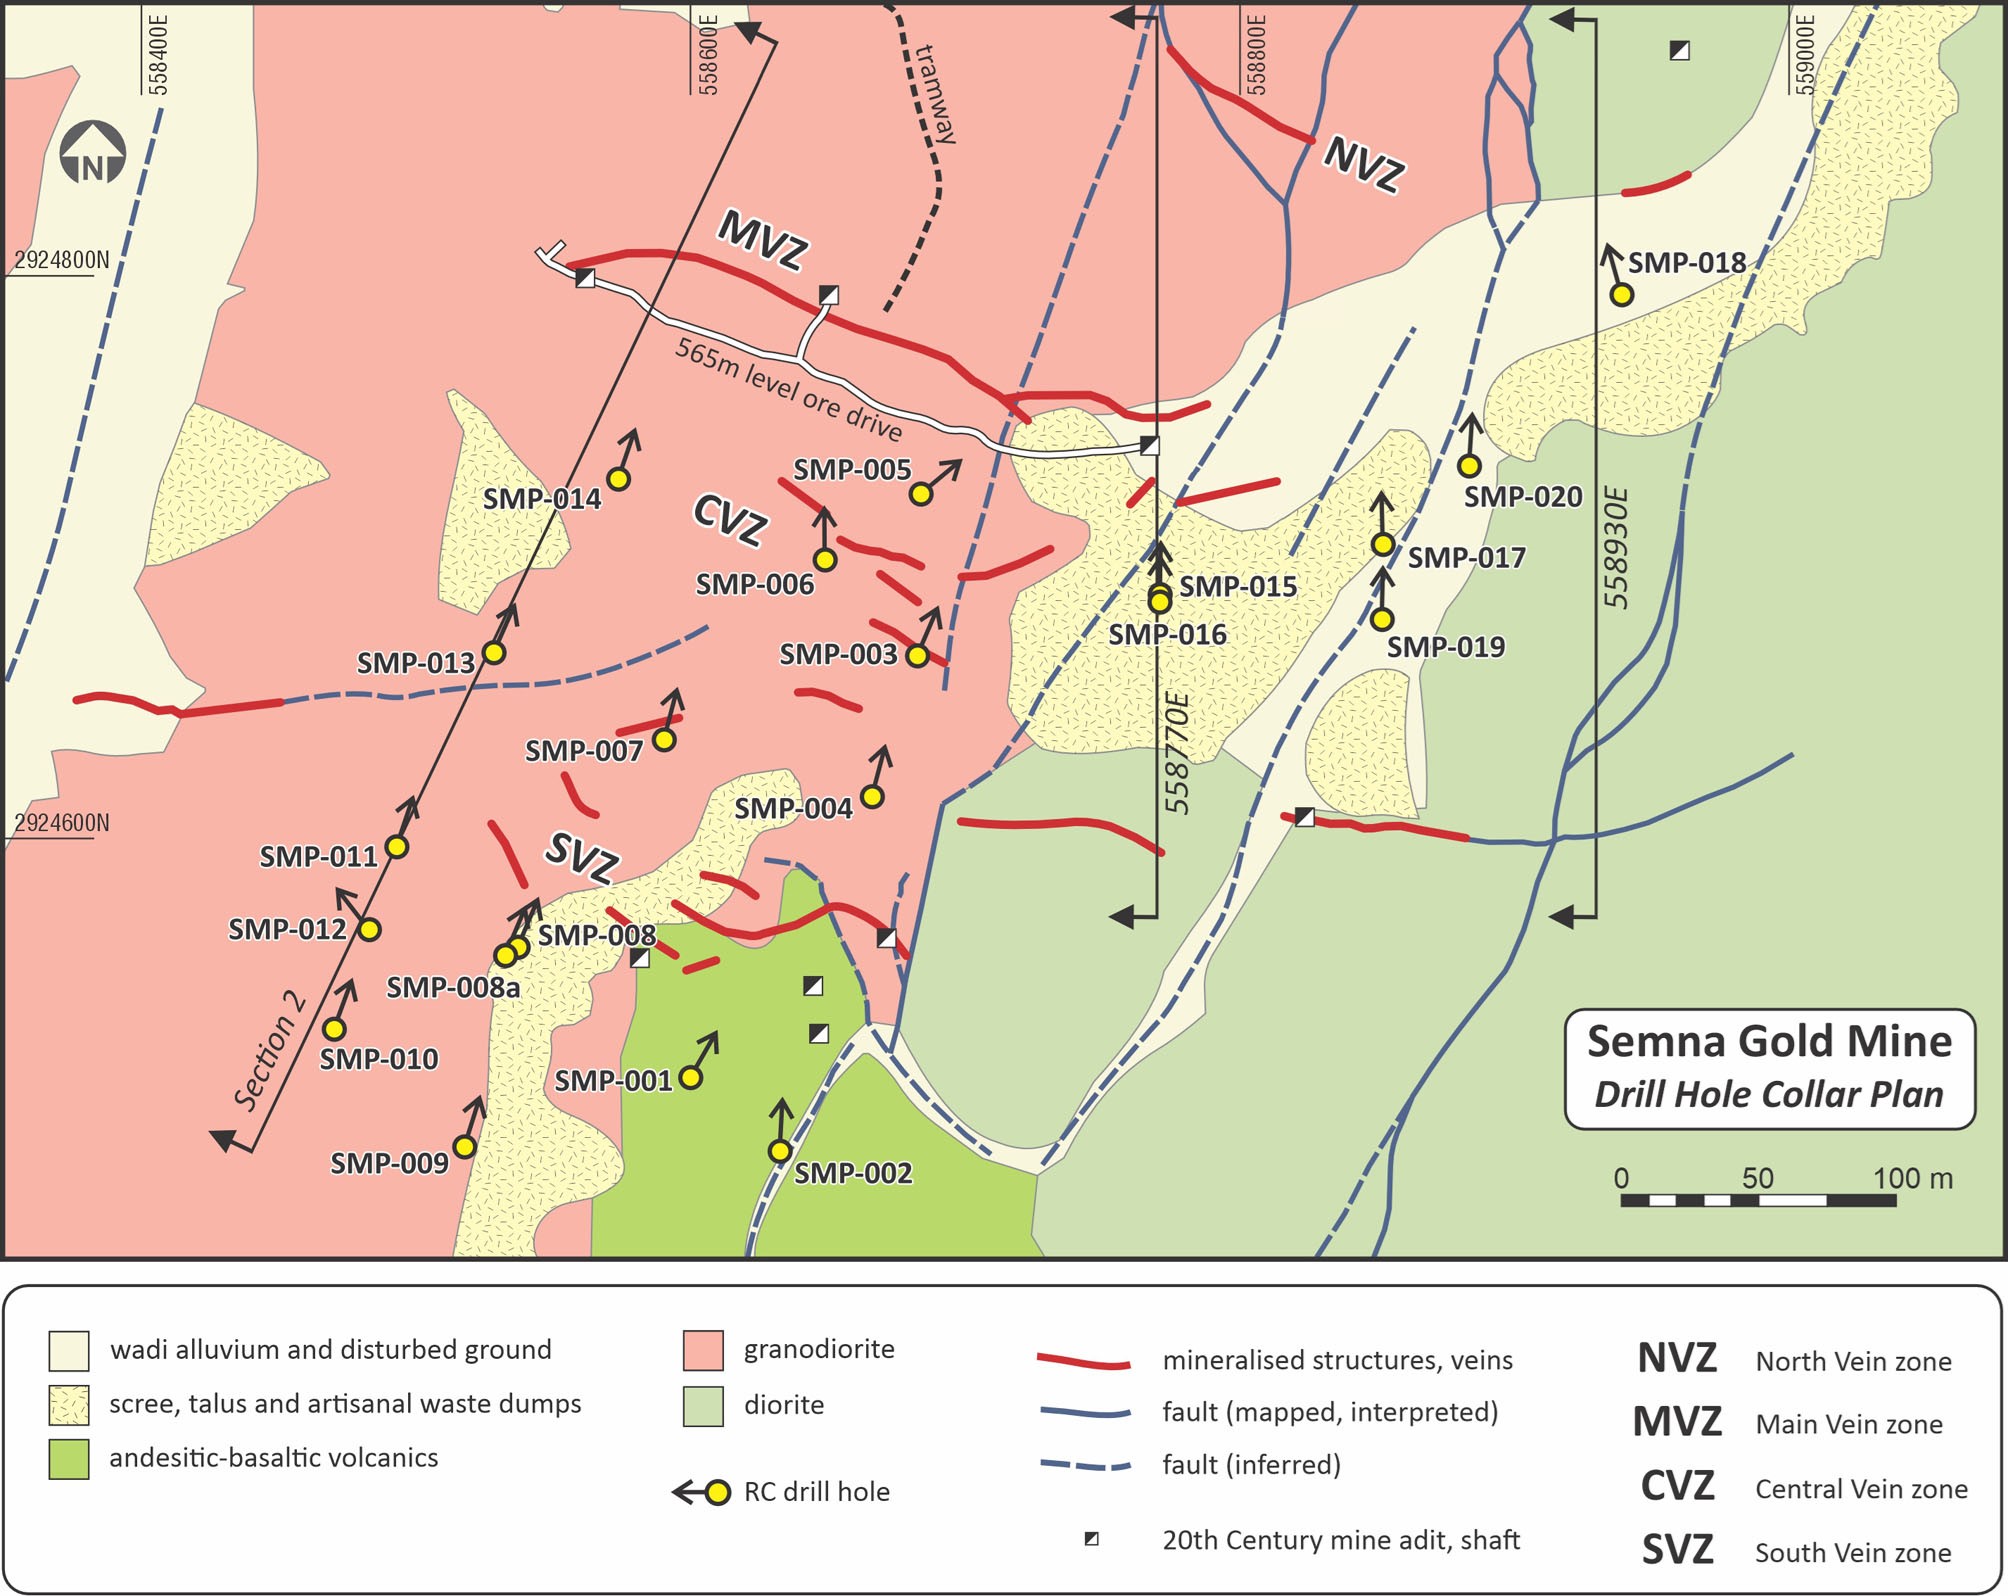
21 drill holes, SMP-001 to SMP-020, were completed at the Semna prospect, for a total of 3,662 metres during the recent RC drill programme (Figure 2). Collar details pf the holes and the results of 4m composite sampling have been previously reported (see news releases dated October 13, 2023 and November 7, 2023). Based on the results of the 4m composite sampling a total of 310 primary 1m split samples through the interpreted mineralised zones were selected and submitted for gold, silver, copper, lead and zinc geochemical analysis. These results are now reported herein.
Full final intersection details from the 1m split samples are provided in Appendix A, and a comparison with the original 4m composite sample intersections from the Main Vein zone ("MVZ") is provided in Appendix B. Selected intersections from the MVZ, which was mined during the 20th century, and has more recently been exploited both at surface and from underground by artisanal miners (see news release dated October 13, 2023) are provided in Table 1.
Holes SMP-001 to SMP-014 were drilled on 3 north-northeast sections across the MVZ, the Central Vein zone ("CVZ"), and the South Vein zone ("SVZ"), see Figure 2. Holes SMP-015 and SMP-016 were drilled on a northerly section at the now exposed eastern end of the 20th century workings, and holes SMP-017 to SMP-020 were drilled to test a postulated eastern extension to the MVZ ("MVZ-EX").
Sporadic narrow mineralisation was intersected from the CVZ and the SVZ. Assay results from the SVZ were unexpectedly low, in light of the presence of old 20th century and the large recent artisanal workings on this zone. More consistent narrow zones of low to moderate grade mineralisation were intersected on the CVZ, for example in holes SMP-003, SMP-006 and SMP-014. The North Vein zone ("NVZ") was not tested in the phase 1 RC drill programme.
Significant mineralised intersections were returned from the MVZ and the MVZ-EX extension zone (see Table 1 and Appendix A), including 50.07 g/t Au over a 6m interval, from 75m downhole depth (hole SMP-016), 28.36 g/t Au, 28.4 g/t Ag and 1.15% Cu over a 4m interval, from 136m downhole depth (hole SMP-003), 11.98 g/t Au over a 16m interval, from 61m downhole depth (hole SMP-018), and 10.61 g/t Au, 24.0 g/t Ag and 1.20% Cu over a 9m interval, from 130m downhole depth (hole SMP-019. Hole SMP-019 also returned intersections of 5.82 g/t Au over a 3m interval from 102m downhole depth, and 9.10 g/t Au over a 2m interval from 111m, indicating the presence of multiple mineralised structures in the MVZ-EX. Schematic interpretations of cross sections 2, 558770E and 558930E are provided in Appendix C.
Hole ID | Section ID | Intersection (m) | Au (g/t) | Ag (g/t) | Cu (ppm) | Comments | ||
From | To | Interval | ||||||
SMP-003 | Section 4 | 136 | 140 | 4 | 28.36 | 28.4 | 11,481 | |
incl. | 137 | 138 | 1 | 94.80 | 88.2 | 34,750 | ||
SMP-004 | Section 4 | 184 | 186 | 2 | 12.45 | 1.5 | 75 | open at depth below |
SMP-006 | Section 3 | 116 | 118 | 2 | 14.20 | 2.8 | 65 | |
SMP-007 | Section 3 | 155 | 157 | 2 | 9.74 | 2.3 | 69 | open at depth below |
SMP-013 | Section 2 | 186 | 189 | 3 | 4.93 | 0.7 | 50 | open at depth below |
SMP-014 | Section 2 | 109 | 114 | 5 | 4.14 | 0.6 | 19 | |
SMP-015 | 558770E | 50 | 52 | 2 | 5.05 | 0.6 | 25 | hangingwall structure |
and | 78 | 81 | 3 | 7.11 | 3.4 | 551 | MVZ structure | |
SMP-016 | 558770E | 75 | 81 | 6 | 50.07 | 6.7 | 1,026 | hangingwall structure, open at depth below |
incl. | 80 | 81 | 1 | 222.0 | 23.2 | 207 | ||
and | 134 | 142 | 8 | 2.39 | 1.8 | 801 | MVZ structure, open at depth below | |
incl. | 139 | 141 | 2 | 7.10 | 1.7 | 105 | ||
SMP-017 | 558850E | 56 | 70 | 14 | 5.73 | 1.5 | 198 | multiple mineralised structures / veins |
incl. | 60 | 63 | 3 | 14.85 | 2.7 | 113 | ||
and incl. | 66 | 69 | 3 | 8.67 | 3.1 | 521 | ||
SMP-018 | 558930E | 61 | 77 | 16 | 11.98 | 2.0 | 46 | most northeasterly intersection - open to NE and at depth below |
incl. | 61 | 65 | 4 | 36.03 | 5.9 | 122 | ||
SMP-019 | 558850E | 102 | 105 | 3 | 5.82 | 8.9 | 259 | multiple mineralised structures / veins, open at depth below |
and | 111 | 113 | 2 | 9.10 | 6.2 | 624 | ||
and | 126 | 127 | 1 | 2.28 | 0.9 | 41 | ||
and | 130 | 139 | 9 | 10.61 | 24.0 | 12,038 | ||
incl. | 130 | 134 | 4 | 19.78 | 43.6 | 22,091 | ||
and incl. | 133 | 134 | 1 | 37.00 | 145.0 | 87,240 | ||
Table 1: Selected final intersections from the Semna MVZ
7 holes targeted the MVZ beneath the old 20th century workings (see Figure C1), on approximately 80m spaced drill sections, specifically SMP-003, SMP-004, SMP-005 (Section 4), SMP-006, SMP-007 (Section 3), and SMP-013 and SMP-014 (Section 2, Figure C1). The old workings have recently been extended down to an approximate elevation of 550m RL by the artisanal miners (see news release dated October 13, 2023). All holes, except SMP-005 which intersected sub-grade mineralisation, returned mineralised intersections with true widths of between approximately 2 and 4 metres, grading between 4.14 g/t Au (5m interval from hole SMP-014) and 28.36 g/t Au (4m interval from hole SMP-003). Individual 1m samples from this area returned assays including 94.8 g/t Au (hole SMP-003), 25.7 g/t Au (SMP-006) and 17.75 g/t Au (SMP-007). The drilling confirmed the continuity of the mineralisation beneath the mined out upper parts of the MVZ. The MVZ continued at an average dip of approximately 70° to the SSW, although the zone appears to shallow in the deepest holes. It is not clear if this is due to the MVZ actually shallowing, or if it is due to the presence of multiple en echelon mineralised structures (Figure C1). The mineralisation on the MVZ was open at depth on all sections beneath the old mine workings.
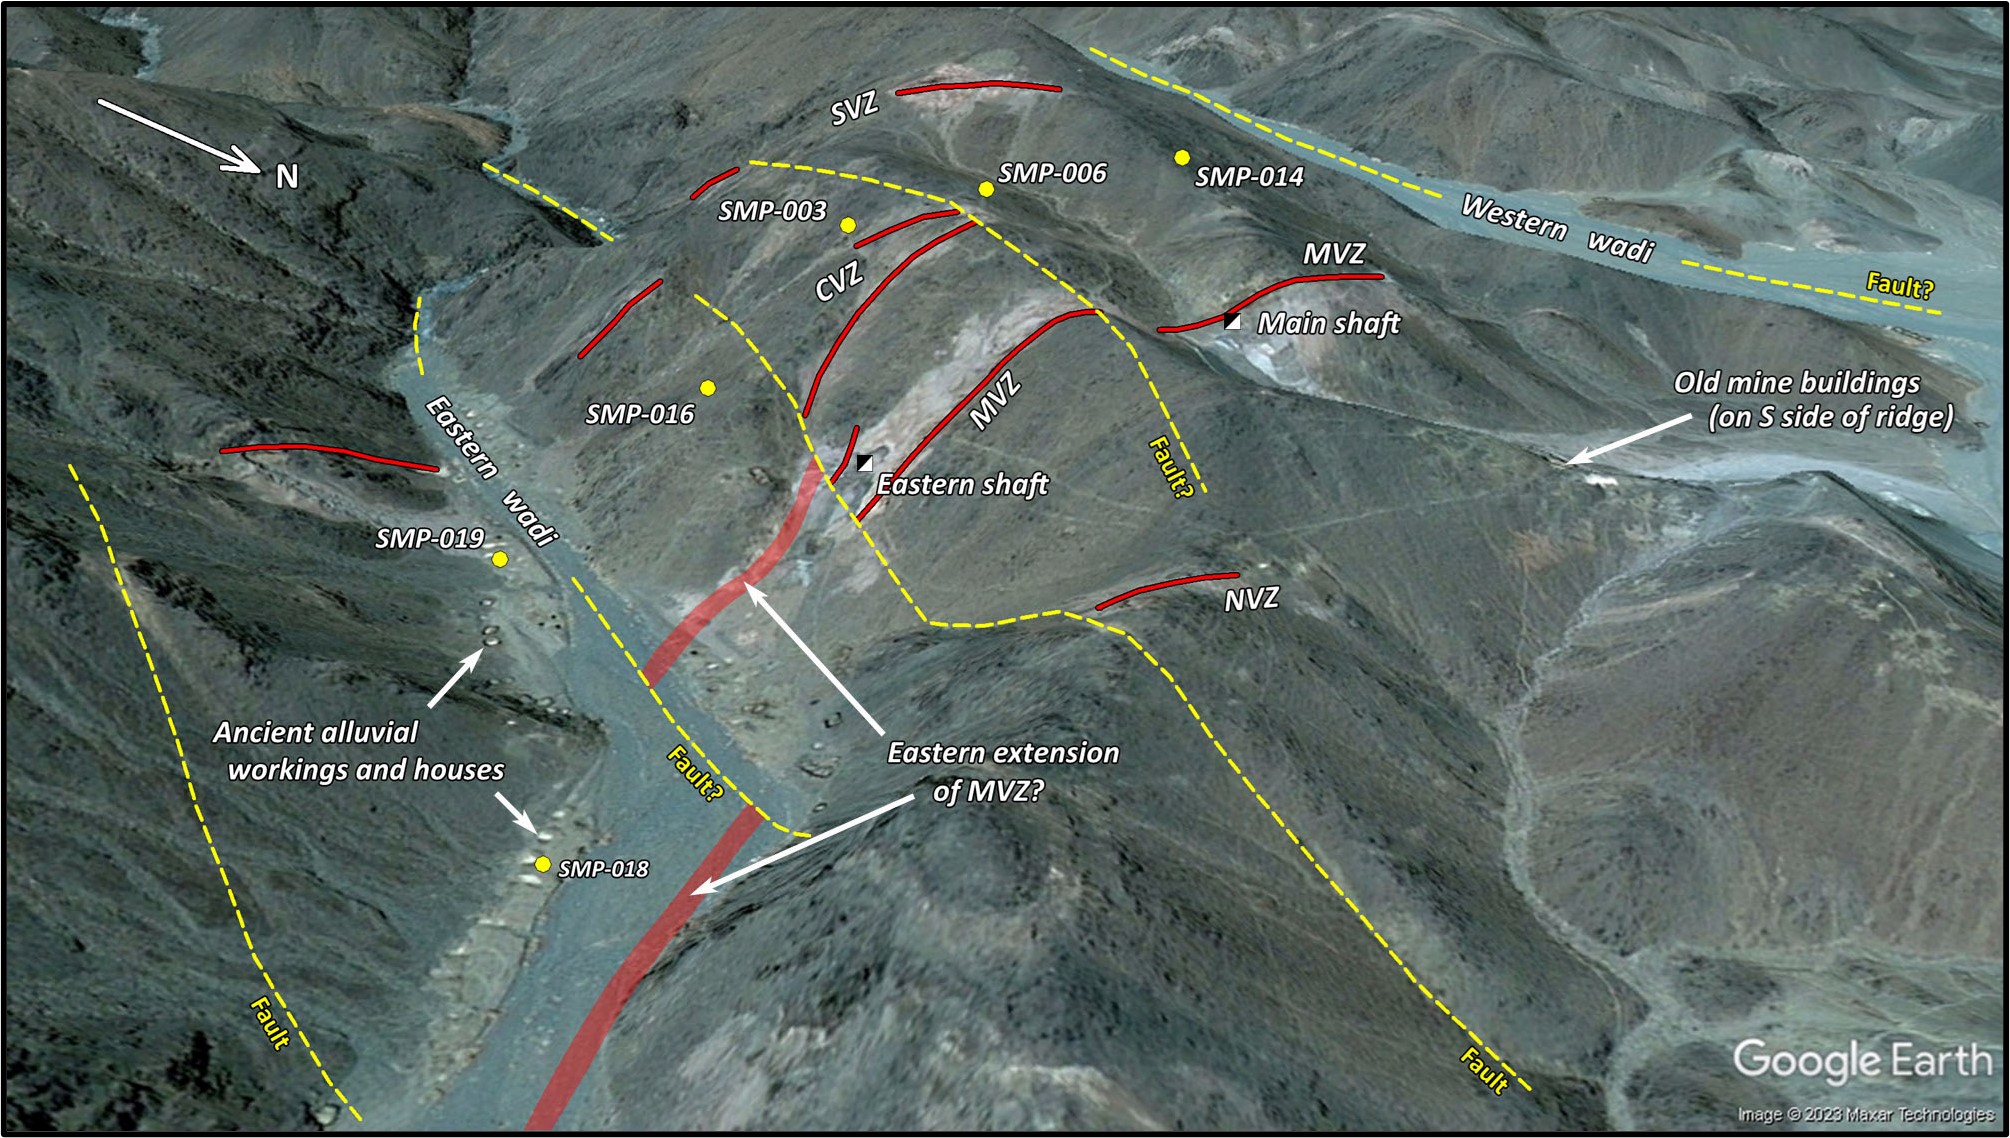
Holes SMP-015 and SMP-016 were drilled at the eastern end of the 20th century workings, close to the eastern shaft, where the MVZ appears to swing around to a more easterly or east-northeasterly orientation. The MVZ appears to be faulted out here, and surface mapping of the area, now exposed by the artisanal miners, suggests that the MVZ has been sinistrally displaced by approximately 40m to the southwest (Figures 2 and 3).
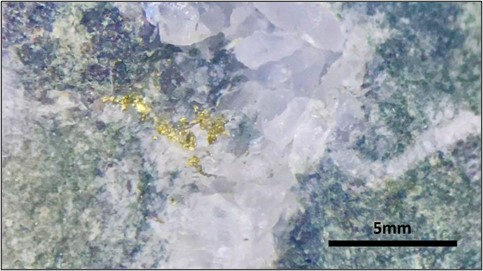
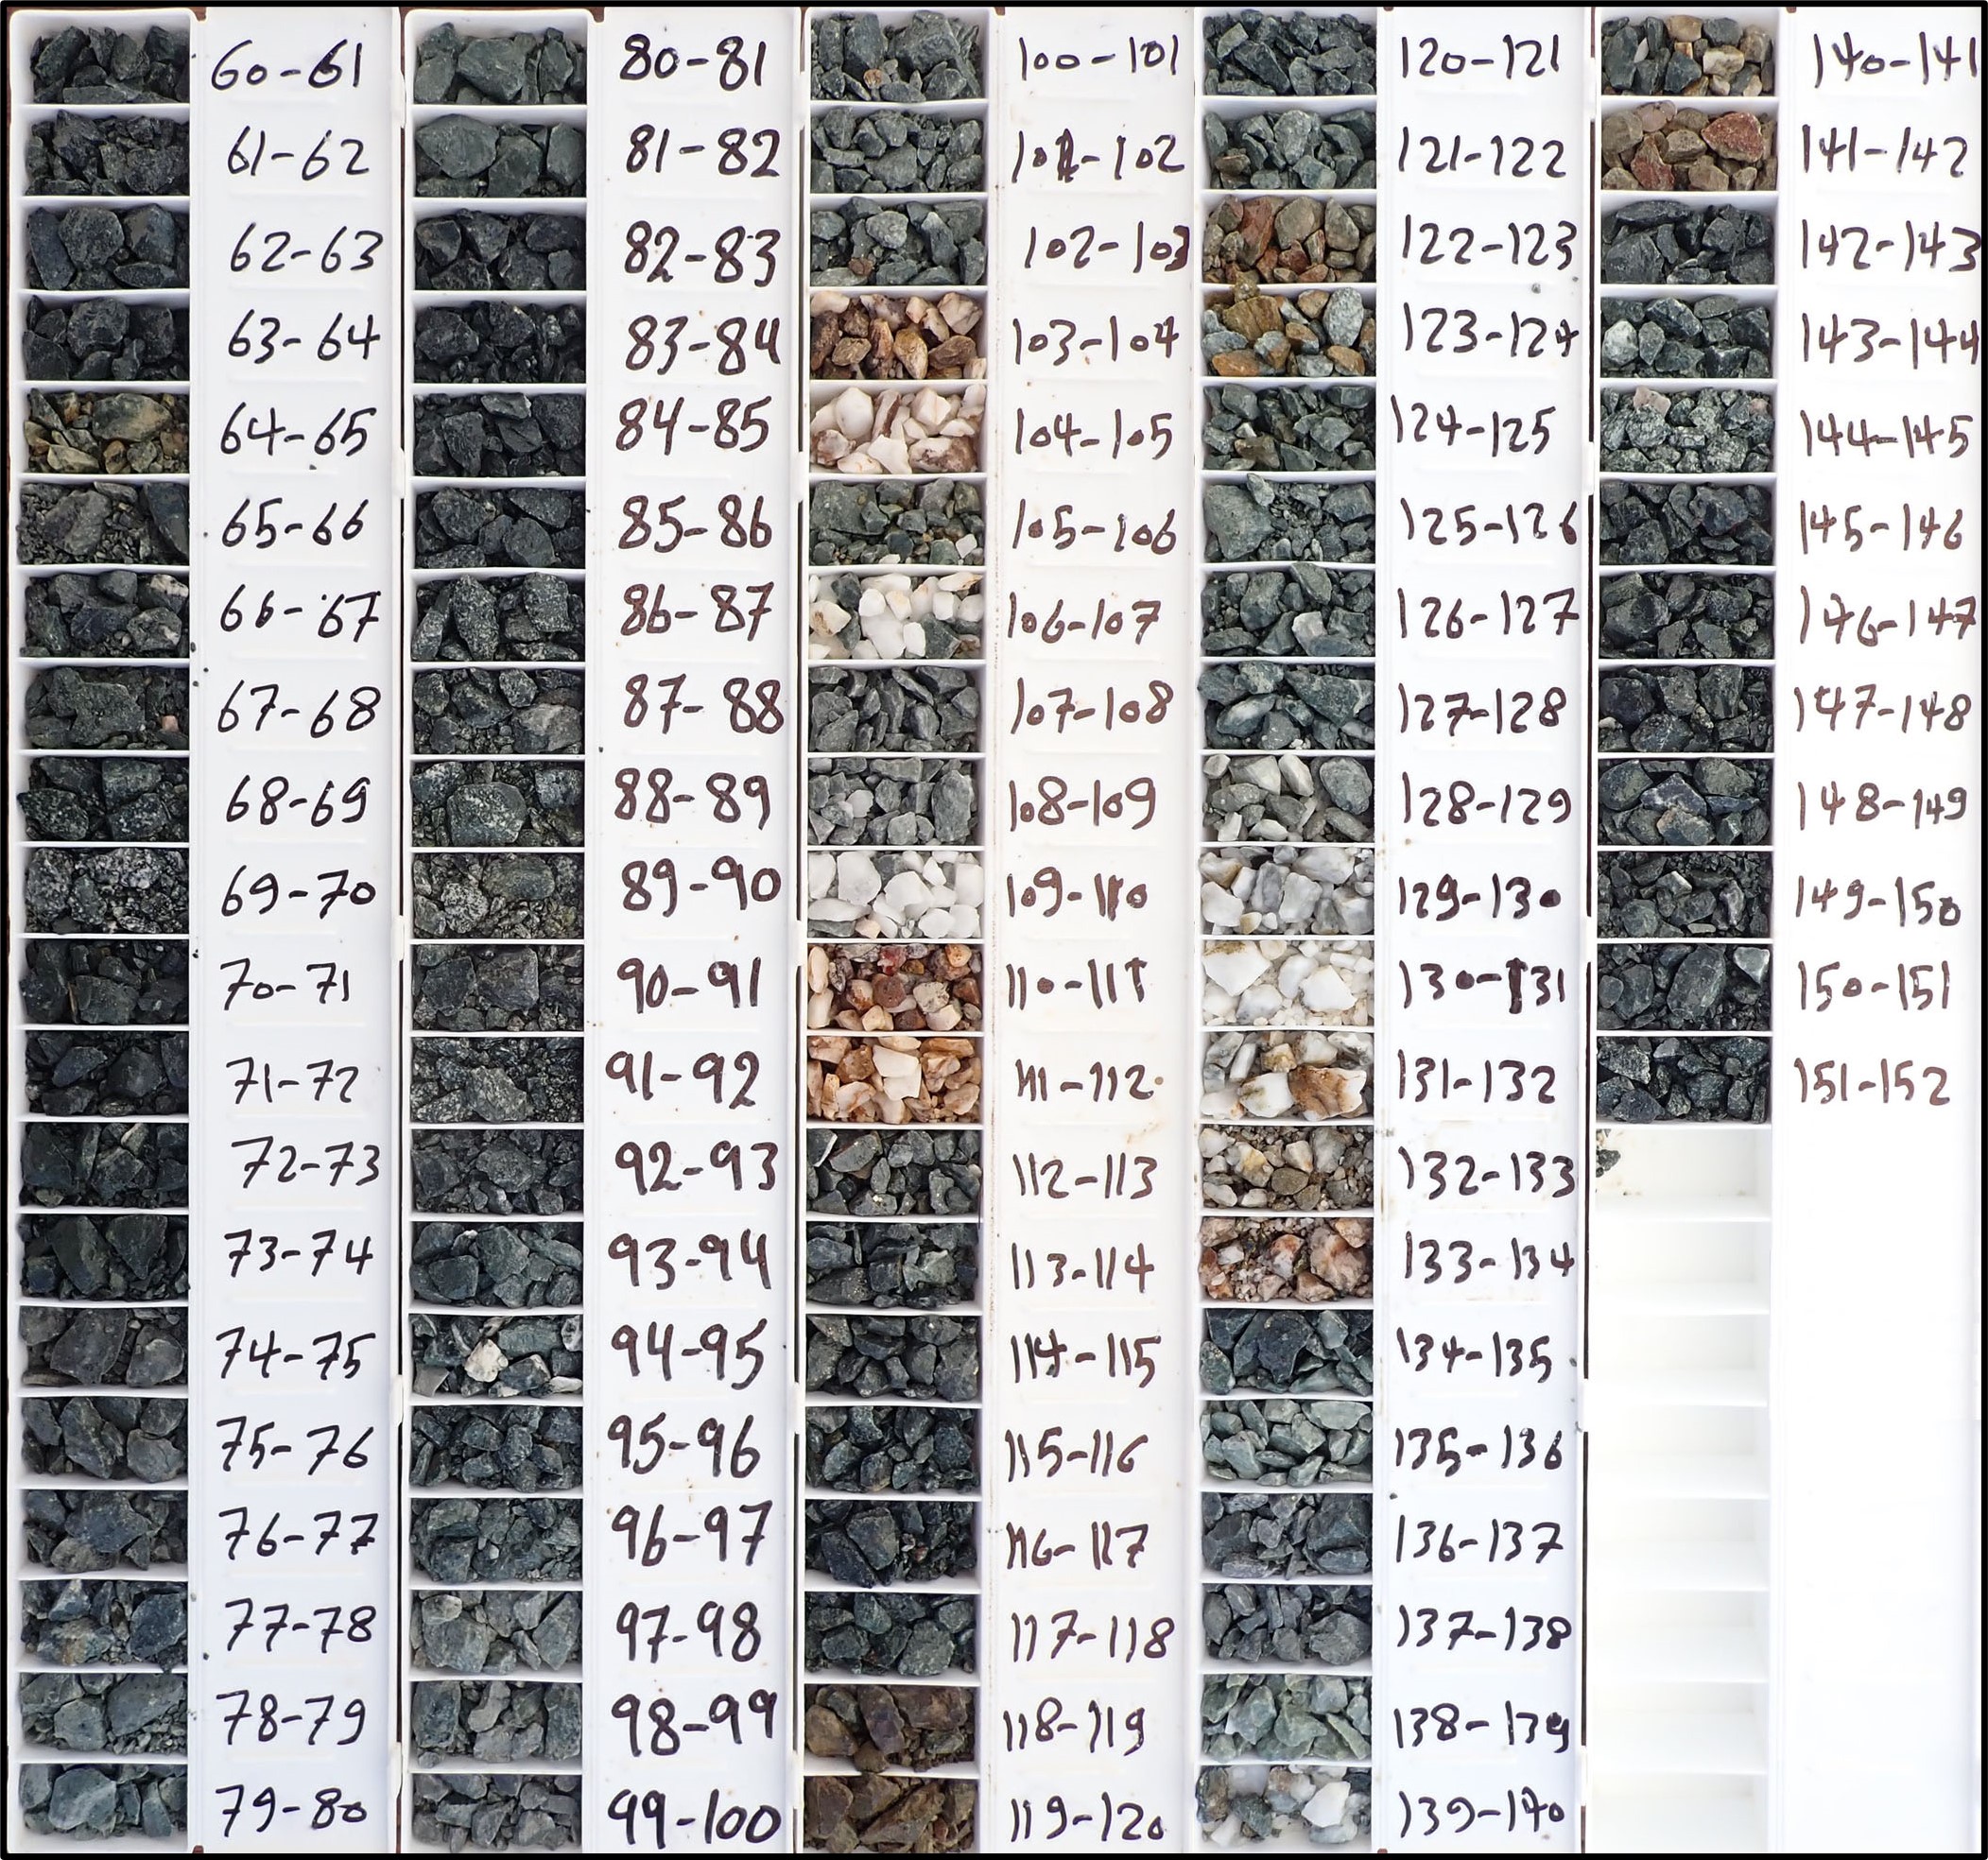
Holes SMP-015 and SMP-016 both intersected 2 discrete mineralised zones, with true widths of approximately 2-4m (Figure C2). The northern or footwall zone is interpreted as being the main MVZ, while the southern hangingwall zone is interpreted as being a separate structure striking approximately southwest which appears to join with the CVZ. Both mineralised zones dip at approximately 75° to the south. The hangingwall zone returned an intersection of 50.07 g/t Au over an interval of 6m (true width approximately 3m). Inspection of the drill chips indicated the presence of abundant coarse gold (Figure 4), with individual 1m samples from this 6m interval returning assays including 222.0, 40.8 and 20.3 g/t Au. Examination of blocks of mineralised rock from surface in this area also showed the presence of abundant coarse visible gold.
The final 4 holes of the programme, SMP-017 to SMP-020 were drilled to test a postulated eastern extension of the MVZ, running parallel to a "jog" in the eastern wadi (Figures 2 and 3), the so-called "MVZ-EX" zone. 3 of the holes returned wide zones of high grade mineralisation.
SMP-017 was drilled on a northerly azimuth on the 558850E section, and returned a mineralised intersection of 5.73 g/t Au over a 14m interval, from 56m downhole depth, and beneath it SMP-019 returned mineralised intersections of 5.82 g/t Au over a 3m interval, from 102m downhole depth, 9.10 g/t Au over a 2m interval from 111m, and 10.61 g/t Au over a 9m interval from 130m downhole depth (see Table 1 and Appendix A). Individual 1m samples from SMP-017 returned assays including 18.25, 13.8 and 16.25 g/t Au, while individual 1m samples from SMP-019 returned assays including 37.0, 22.6 and 15.6 g/t Au.
Hole SMP-018 was drilled slightly oblique to the 558930E section approximately 160m east of the underground mine workings, and was the easternmost hole in the programme. SMP-018 returned a mineralised intersection of 11.98 g/t Au over a 16m interval, from 61m downhole depth (see Table 1, Appendix A and Figure C3). This interval included individual 1m samples which returned assays including 51.8, 47.1, 24.1 and 21.1 g/t Au. In this locality the MVZ-EZ is interpreted as being approximately vertical, with a true width of approximately 10-12m. Hole SMP-020 was drilled on the 558890E section between the other holes (Figure 2), and is interpreted as having missed the MVZ-EX zone, which had here been offset by a NNE-striking fault.
Comparison of 1m split sample and 4m composite sample results
A comparison between all the final 1m split and 4m composite assay intersections is provided in Appendix B, and selected comparative intersections from the MVZ are provided below in Table 2.
Hole ID | 1m split samples | 4m composite samples | ||||||
Intersection (m) | Au (g/t) | Intersection (m) | Au (g/t) | |||||
From | To | Interval | From | To | Interval | |||
SMP-003 | 136 | 140 | 4 | 28.36 | 136 | 140 | 4 | 29.80 |
SMP-004 | 184 | 186 | 2 | 12.45 | 184 | 188 | 4 | 5.37 |
SMP-006 | 116 | 118 | 2 | 14.20 | 116 | 120 | 4 | 6.27 |
SMP-014 | 109 | 114 | 5 | 4.14 | 108 | 116 | 8 | 2.86 |
SMP-015 | 50 | 52 | 2 | 5.05 | 48 | 52 | 4 | 2.52 |
and | 78 | 81 | 3 | 7.11 | 76 | 84 | 8 | 3.03 |
SMP-016 | 75 | 81 | 6 | 50.07 | 72 | 84 | 12 | 14.63 |
and | 134 | 142 | 8 | 2.39 | 132 | 144 | 12 | 1.78 |
SMP-017 | 56 | 70 | 14 | 5.73 | 56 | 72 | 16 | 5.19 |
SMP-018 | 61 | 77 | 16 | 11.98 | 60 | 76 | 16 | 12.54 |
SMP-019 | 102 | 105 | 3 | 5.82 | 96 | 116 | 20 | 1.69 |
and | 111 | 113 | 2 | 9.10 | ||||
and | 130 | 139 | 9 | 10.61 | 124 | 140 | 16 | 6.30 |
Notes:
| ||||||||
Table 2: Selected final 1m split and 4m composite sample intersections from the Semna MVZ
The results show good correlation in general and confirm the validity of the sample compositing methodology, and its execution. In general the results correlate very well, although in the case of SMP-016, the grade from the upper 1m split sample intersection was significantly higher than that expected from the 4m composite samples. This is clearly a response to the nugget effect of samples containing abundant coarse gold, with individual 1m samples from this interval returning assays including 222.0, 40.8 and 20.3 g/t Au.
Discussion of results
The mineralisation at Semna appears to be mainly hosted in a body of quartz diorite to granodiorite that has been intruded into a package of mafic to intermediate composition metavolcanic rocks. The mineralisation is strongly structurally controlled, and is hosted in a series of steeply south-dipping shear zones that contain the gold-bearing quartz veins. These sub-parallel quartz veins strike approximately east-west and dip 60-75° to the south, but the dip and strike is quite variable within each vein, and the veins noticeably pinch and swell, as has been historically reported.
The overall vein array is quite complex, with the various zones appearing to be connected in places. Drilling has indicated the best mineralisation to be on the historically mined MVZ, however mapping indicates numerous ancient and 20th century workings on the other structures, and previous surface sampling by Aton returned some of the best results from the SVZ (see news release dated November 22, 2017).
In the Semna area both the mineralisation and topography are structurally controlled. The historic Semna mine is located between two wadis orientated in a NNE direction, which are interpreted as being controlled by north-northeast striking faults (see news release dated November 7, 2023). Mapping has indicated the presence of a sub-parallel series of these north-northeast fault structures, which offset the mineralised zones (Figures 2 and 3). The MVZ typically strikes in an east-southeasterly direction, dipping to the south-southwest. Towards the end of the now exposed underground workings, and in the interpreted eastern extension of the MVZ its strike appears to swing around to an east-northeasterly direction (Figures 2 and 3), where it is largely covered by wadi sediments, interpreted as being approximately 10m thick. In this MVZ-EX zone the dip of the mineralisation appears to be steepening to a more vertical orientation (Figure C3).
The mineralisation at Semna is orogenic in style, and is interpreted as being associated with an array of structures, presumed to have formed in dilational zones, accompanied by shearing and weak to moderate phyllic wallrock alteration. The mineralised structures are localised between and offset by a series of north-northeast striking fault structures. Mineralisation on the MVZ is associated with at least one mineralised quartz vein, which anastomoses and pinches and swells, as confirmed by Aton's underground mapping reported (see news release dated October 13).
Historically the MVZ mineralised zone has been described as being up to 6m in thickness, but interpretation of the results from holes SMP-015 to SMP-019 suggests that the mineralisation is associated with multiple veins and structures (Figures 5 and C2), to the east of the 20th century underground mine workings. The overall mineralised 'envelope' may potentially be up to 10-35m in true width in the eastern extension of the MVZ under the alluvial wadi sediments. In the MVZ-EX lower grade mineralisation appears to occur in wider zones, not exclusively adjacent to the mineralised quartz veins, and is apparently associated with heavily sheared and altered wallrock.
The mineralised structures are almost always associated with white quartz veins, with gold appearing to be distributed both within the quartz veins themselves, and also in altered selvages and wallrock adjacent to the veins. The mineralisation at Semna is associated with low levels of sulphide gangue, and predominantly carries only gold. The gold at Semna appears to be coarse and nuggety, as indicated by examination of samples, and also analysis of the drill assay results. 23 of the total of 310 1m split samples submitted for analysis returned gold values greater than 10 g/t, with 11 of these returning gold values greater than 20 g/t, including individual assays of 222.0, 94.8 and 51.8 g/t Au. The drill results appear to confirm the historical and anecdotal evidence that the gold mineralisation at Semna is of a significantly high grade, and is locally of bonanza grade.
Levels of silver and copper are generally at Semna, but can be locally significant. Where silver and copper grades are elevated this is typically associated with high to very high grades of gold (eg. 28.36 g/t Au, 28.4 g/t Ag and 1.15% Cu over a 4m interval in hole SMP-003, 19.78 g/t Au, 43.6 g/t Ag and 2.21% Cu over a 4m interval in hole SMP-019, see Appendix A). Lead and zinc occurred only at very low levels in all the drill assay results.
The mineralisation at Semna is open along strike at both ends, and has to date been drilled over a strike length on the MVZ of approximately 400m. The mineralisation is open at depth along the entire drilled strike length.
Exploration activity update
Aton intends to start a second phase of diamond drilling at Semna as early as possible in 2024, pending the anticipated issuance of the exploitation lease at Abu Marawat, with a view to fast-tracking the exploration at the Semna prospect. Pending the start of the phase 2 drilling the Company has been continuing its exploration activities at Semna, while it awaits the issuance of the exploitation lease, as follows:
- A provisional plan for an initial 50 hole phase 2 diamond drilling programme at Semna has been developed. The drilling will be undertaken by Energold Drilling (EMEA) Limited, using their Global Drilling ID500-G track-mounted rig (see news release dated November 23, 2021), which is currently in storage at Hamama. New drill pipe and other equipment has already been ordered, and preparations for its shipment to Egypt are underway. Drill site and pad preparation for the planned phase 2 drill programme has largely been completed already.
- A short programme of mechanical saw-cut channel sampling has been undertaken on exposed faces at Semna. Results from this programme are anticipated soon, and will be reported in early 2024.
- A short programme of metallic screen fire assay analysis on some of the high grade samples from Semna has been undertaken, to assess the relative abundance of coarse gold in the Semna mineralisation, and the results will again be reported in early 2024.
- 2 composite samples of the Semna MVZ mineralisation have been dispatched to Wardell Armstrong International in the UK for preliminary gravity separation and whole ore leach metallurgical testwork. The results of this programme are expected by the end of 2023, and will also be reported in early 2024.
Sampling and analytical procedures
The RC holes were drilled at 5¾" or 5½" diameter, and the bulk percussion chip samples were collected directly into pre-written large plastic bags from the cyclone every metre, numbered with the hole number and hole depths, and laid out sequentially at the drill site. Between each metre of drilling the cyclone was cleaned out with compressed air. The bags were logged on the drill sites by Aton geologists. The bulk 1m samples were weighed, and subsequently riffle split through a 3-tier splitter at the drill site by Aton field staff to produce an approximately 1/8 split, which was collected in cloth bags, numbered and tagged with the hole number and depth. The splitter was cleaned with compressed air between each sample. The reject material from this initial bulk split was re-bagged, labelled and tagged, and retained on the drill sites. A representative sample of each metre was washed and stored in marked plastic chip trays, each containing 20m of samples, photographed, and retained onsite as a permanent record of the drill hole.
The 1m split samples, weighing approximately 5kg each were then transported to the Rodruin sample processing facility, where they were 1/2 riffle split into 2 separate sub-samples, weighing approximately 2.5kg. One of these sub-samples was marked and labelled, and retained at the laboratory for storage. The second 1m sub-samples were then combined into 4m composite samples, weighing approximately 10kg. These were thoroughly mixed and again riffle split to produce nominal c. 250-500g 4m composite samples which were dispatched to ALS Minerals for analysis. Again the splitter was cleaned with compressed air between each sample. The 4m composite samples were allocated new sample numbers. The bulk reject material from the riffle split 4m composite samples was disposed of. QAQC samples were inserted into the 4m composite sample stream at a rate of approximately 1 certified reference material (or "standard" sample) every 60 samples, 1 blank sample every 30 samples, and 1 field duplicate split sample every 30 samples.
The 4m composite samples were shipped to ALS Minerals sample preparation laboratory at Marsa Alam, Egypt, where they were pulverised to a size fraction of better than 85% passing 75 microns. From this pulverised material a further sub-sample was split off with a nominal c. 50g size, which was shipped on to ALS Minerals at Rosia Montana, Romania for analysis. The 4m composite samples were analysed for gold by fire assay with an atomic absorption spectroscopy ("AAS") finish (analytical code Au-AA23. High grade samples (Au >10 g/t) were re-analysed using analytical code Au-GRA21 (also fire assay, with a gravimetric finish).
Following the receipt of the final 4m composite assay results for the full Semna programme from ALS, a number of the retained 1m sub-samples were selected by a senior Aton geologist for re-assaying, corresponding to 4m composite assays deemed to be of significance. The selected 1m sub-samples were again riffle split to produce nominal c. 250-500g 1m split samples which were allocated new sample numbers. These were again dispatched to ALS Minerals for the same sample preparation at Marsa Alam, and for subsequent analysis at Rosia Montana. The bulk reject material from the 1m sub-sample splits was re-bagged and retained onsite for storage at Rodruin. QAQC samples were inserted into the 1m split sample stream at a rate of approximately 1 standard every 30 samples, 1 blank sample every 15 samples, and 1 field duplicate split sample every 15 samples.
The 1m split samples were again analysed for gold by fire assay (analytical code Au-AA23), and for silver, copper, lead and zinc using an aqua regia digest followed by an AAS finish (analytical code AA45). Any high grade gold samples (Au >10 g/t) were re-analysed using analytical code Au-GRA21 (also fire assay, with a gravimetric finish). Any high grade Ag and base metal samples (Ag >100 g/t, and Cu, Pb and Zn >10,000ppm or >1%) were re-analysed using the ore grade technique AA46 (also an aqua regia digest followed by an AAS finish).
About Aton Resources Inc.
Aton Resources Inc. (AAN: TSX-V) is focused on its 100% owned Abu Marawat Concession ("Abu Marawat"), located in Egypt's Arabian-Nubian Shield, approximately 200 km north of Centamin's world-class Sukari gold mine. Aton has identified numerous gold and base metal exploration targets at Abu Marawat, including the Hamama deposit in the west, the Abu Marawat deposit in the northeast, and the advanced Rodruin exploration prospect in the south of the Concession. Two historic British gold mines are also located on the Concession at Sir Bakis and Semna. Aton has identified several distinct geological trends within Abu Marawat, which display potential for the development of a variety of styles of precious and base metal mineralisation. Abu Marawat is 447.7 km2 in size and is located in an area of excellent infrastructure; a four-lane highway, a 220kV power line, and a water pipeline are in close proximity, as are the international airports at Hurghada and Luxor.
Qualified person
The technical information contained in this News Release was prepared by Javier Orduña BSc (hons), MSc, MCSM, DIC, MAIG, SEG(M), Exploration Manager of Aton Resources Inc. Mr. Orduña is a qualified person (QP) under National Instrument 43-101 Standards of Disclosure for Mineral Projects.
For further information regarding Aton Resources Inc., please visit us at www.atonresources.com or contact:
TONNO VAHK
Interim CEO
Tel: +1 604 318 0390
Email: info@atonresources.com
Note Regarding Forward-Looking Statements
Some of the statements contained in this release are forward-looking statements. Since forward-looking statements address future events and conditions; by their very nature they involve inherent risks and uncertainties. Actual results in each case could differ materially from those currently anticipated in such statements.
Neither TSX Venture Exchange nor its Regulation Services Provider (as that term is defined in policies of the TSX Venture Exchange) accepts responsibility for the adequacy or accuracy of this release.
Appendix A - Semna final assay results
Hole ID | Intersection (m) | Au (g/t) | Ag (g/t) | Cu (ppm) | Pb (ppm) | Zn (ppm) | Zone | Comments | ||
From | To | Interval | ||||||||
SMP-001 | 28 | 30 | 2 | 2.40 | 0.7 | 33 | 7 | 42 | SVZ |
|
SMP-002 | 22 | 23 | 1 | 2.37 | 0.9 | 24 | 7 | 65 | SVZ |
|
SMP-003 | 29 | 31 | 2 | 1.07 | 0.1 | 66 | 6 | 53 | CVZ |
|
and | 136 | 140 | 4 | 28.36 | 28.4 | 11,481 | 7 | 44 | MVZ |
|
incl. | 137 | 138 | 1 | 94.80 | 88.2 | 34,750 | 8 | 42 | ||
SMP-004 | 132 | 134 | 2 | 1.64 | 0.6 | 47 | 6 | 98 | CVZ? |
|
and | 184 | 186 | 2 | 12.45 | 1.5 | 75 | 7 | 65 | MVZ | open at depth below |
SMP-005 | 62 | 64 | 2 | 2.95 | 0.6 | 11 | 7 | 52 | MVZ | hangingwall zone? |
and | 91 | 92 | 1 | 0.94 | 0.4 | 17 | 6 | 40 | MVZ | sub-grade intersection |
SMP-006 | 11 | 12 | 1 | 1.32 | 0.2 | 14 | 5 | 60 | CVZ |
|
and | 15 | 16 | 1 | 2.68 | 0.6 | 115 | 7 | 67 | CVZ |
|
and | 116 | 118 | 2 | 14.20 | 2.8 | 65 | 7 | 48 | MVZ |
|
SMP-007 | 155 | 157 | 2 | 9.74 | 2.3 | 69 | 9 | 57 | MVZ | open at depth below |
and | 179 | 180 | 1 | 1.10 | 0.2 | 56 | 6 | 60 | MVZ | MVZ footwall zone? |
SMP-009 | 105 | 107 | 2 | 1.28 | 0.6 | 51 | 7 | 52 | SVZ |
|
SMP-011 | 112 | 113 | 1 | 2.67 | 0.8 | 68 | 7 | 98 | SVZ |
|
SMP-012 | 54 | 55 | 1 | 1.27 | 0.1 | 32 | 8 | 79 | SVZ? | south of main SVZ |
and | 135 | 136 | 1 | 1.15 | 0.3 | 29 | 7 | 31 | WVZ | Western vein |
SMP-013 | 186 | 189 | 3 | 4.93 | 0.7 | 50 | 9 | 45 | MVZ | open at depth below |
SMP-014 | 43 | 45 | 2 | 2.79 | 0.4 | 44 | 8 | 43 | CVZ |
|
and | 109 | 114 | 5 | 4.14 | 0.6 | 19 | 6 | 38 | MVZ |
|
SMP-015 | 50 | 52 | 2 | 5.05 | 0.6 | 25 | 8 | 71 | MVZ | hangingwall structure |
and | 78 | 81 | 3 | 7.11 | 3.4 | 551 | 6 | 38 | MVZ |
|
SMP-016 | 75 | 81 | 6 | 50.07 | 6.7 | 1,026 | 7 | 74 | MVZ | hangingwall structure, open at depth below |
incl. | 80 | 81 | 1 | 222.0 | 23.2 | 207 | 7 | 91 | ||
and | 134 | 142 | 8 | 2.39 | 1.8 | 801 | 7 | 112 | MVZ | open at depth below |
incl. | 139 | 141 | 2 | 7.10 | 1.7 | 105 | 6 | 100 | ||
SMP-017 | 56 | 70 | 14 | 5.73 | 1.5 | 198 | 9 | 65 | MVZ-EX |
|
incl. | 60 | 63 | 3 | 14.85 | 2.7 | 113 | 10 | 60 | ||
and incl. | 66 | 69 | 3 | 8.67 | 3.1 | 521 | 9 | 60 | ||
SMP-018 | 61 | 77 | 16 | 11.98 | 2.0 | 46 | 8 | 41 | MVZ-EX | most northeasterly intersection - open to NE and at depth below |
incl. | 61 | 65 | 4 | 36.03 | 5.9 | 122 | 10 | 35 | ||
SMP-019 | 102 | 105 | 3 | 5.82 | 8.9 | 259 | 10 | 42 | MVZ-EX | multiple mineralised structures / veins, open at depth below |
and | 111 | 113 | 2 | 9.10 | 6.2 | 624 | 11 | 30 | ||
and | 126 | 127 | 1 | 2.28 | 0.9 | 41 | 8 | 79 | ||
and | 130 | 139 | 9 | 10.61 | 24.0 | 12,038 | 8 | 75 | ||
incl. | 130 | 134 | 4 | 19.78 | 43.6 | 22,091 | 9 | 41 | ||
and incl. | 133 | 134 | 1 | 37.00 | 145.0 | 87,240 | 9 | 115 | ||
SMP-020 | 102 | 104 | 2 | 1.33 | 0.3 | 40 | 7 | 31 | MVZ-EX | mineralised zone cut out by fault? |
Notes:
| ||||||||||
Appendix B - Comparison between final 1m split and 4m composite intersections from the MVZ
Hole ID | 1m split samples | 4m composite samples | ||||||
Intersection (m) | Au (g/t) | Intersection (m) | Au (g/t) | |||||
From | To | Interval | From | To | Interval | |||
SMP-003 | 136 | 140 | 4 | 28.36 | 136 | 140 | 4 | 29.80 |
incl. | 137 | 138 | 1 | 94.80 | ||||
SMP-004 | 184 | 186 | 2 | 12.45 | 184 | 188 | 4 | 5.37 |
SMP-005 | 62 | 64 | 2 | 2.95 | 60 | 64 | 4 | 1.60 |
and | 91 | 92 | 1 | 0.94 | 88 | 92 | 1 | 0.26 |
SMP-006 | 116 | 118 | 2 | 14.20 | 116 | 120 | 4 | 6.27 |
SMP-007 | 155 | 157 | 2 | 9.74 | 156 | 160 | 4 | 7.03 |
and | 179 | 180 | 1 | 1.10 | 176 | 180 | 4 | 0.50 |
SMP-013 | 186 | 189 | 3 | 4.93 | 184 | 192 | 8 | 2.20 |
SMP-014 | 109 | 114 | 5 | 4.14 | 108 | 116 | 8 | 2.86 |
SMP-015 | 50 | 52 | 2 | 5.05 | 48 | 52 | 4 | 2.52 |
and | 78 | 81 | 3 | 7.11 | 76 | 84 | 8 | 3.03 |
SMP-016 | 75 | 81 | 6 | 50.07 | 72 | 84 | 12 | 14.63 |
incl. | 80 | 81 | 1 | 222.0 | ||||
and | 134 | 142 | 8 | 2.39 | 132 | 144 | 12 | 1.78 |
incl. | 139 | 141 | 2 | 7.10 | ||||
SMP-017 | 56 | 70 | 14 | 5.73 | 56 | 72 | 16 | 5.19 |
incl. | 60 | 63 | 3 | 14.85 | ||||
and incl. | 66 | 69 | 3 | 8.67 | ||||
SMP-018 | 61 | 77 | 16 | 11.98 | 60 | 76 | 16 | 12.54 |
incl. | 61 | 65 | 4 | 36.03 | ||||
SMP-019 | 102 | 105 | 3 | 5.82 | 96 | 116 | 20 | 1.69 |
and | 111 | 113 | 2 | 9.10 | ||||
and | 126 | 127 | 1 | 2.28 | 124 | 140 | 16 | 6.30 |
and | 130 | 139 | 9 | 10.61 | ||||
incl. | 130 | 134 | 4 | 19.78 | ||||
and incl. | 133 | 134 | 1 | 37.00 | ||||
SMP-020 | 102 | 104 | 2 | 1.33 | 100 | 104 | 4 | 1.20 |
Notes:
| ||||||||
Appendix C - Semna cross sections
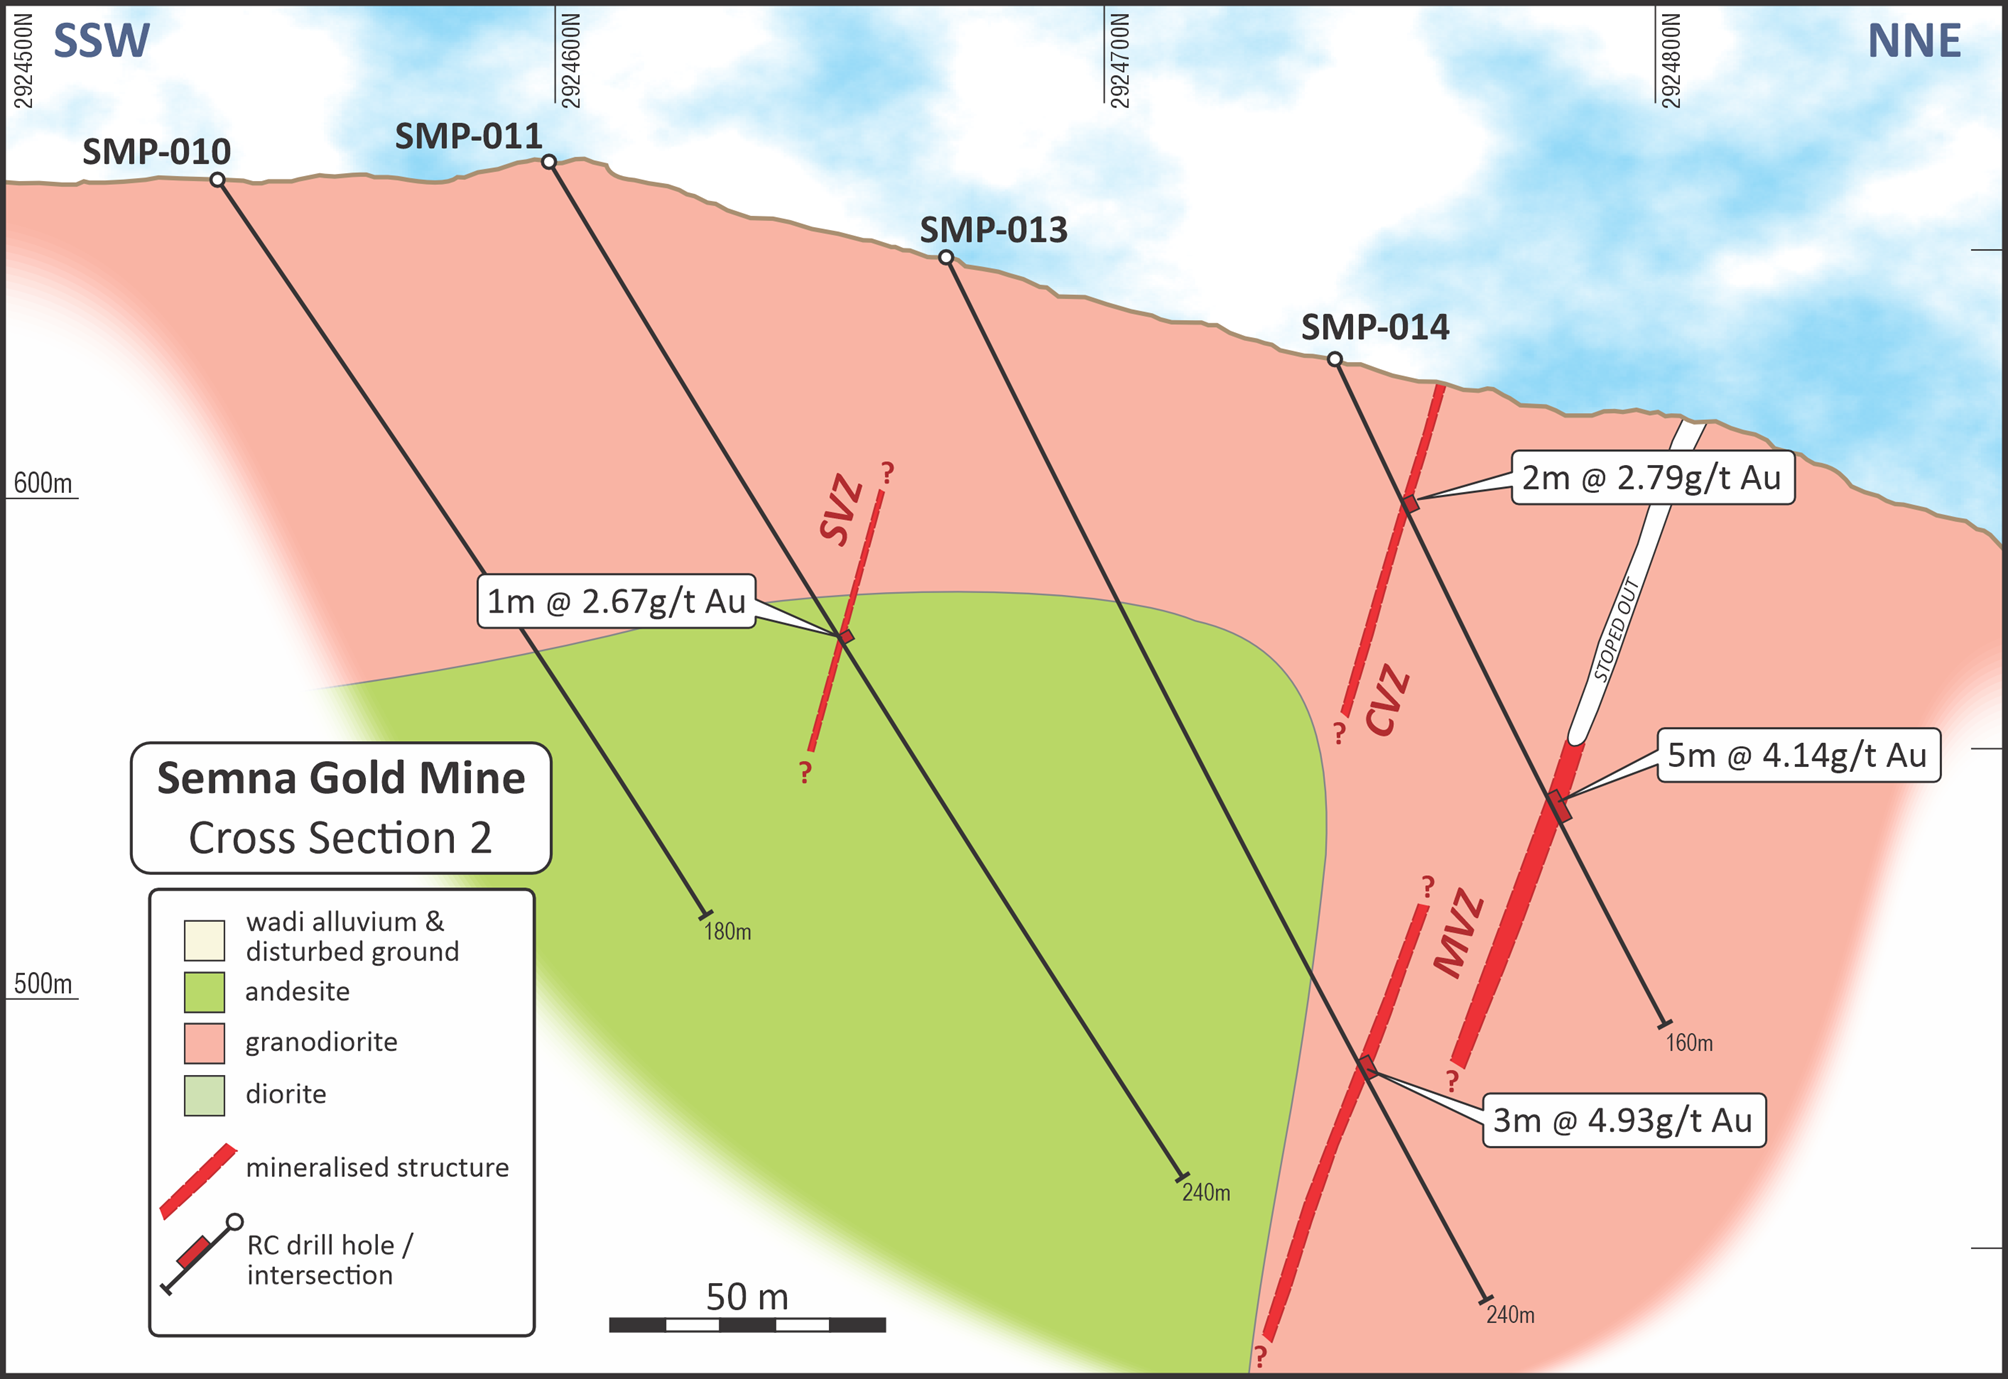
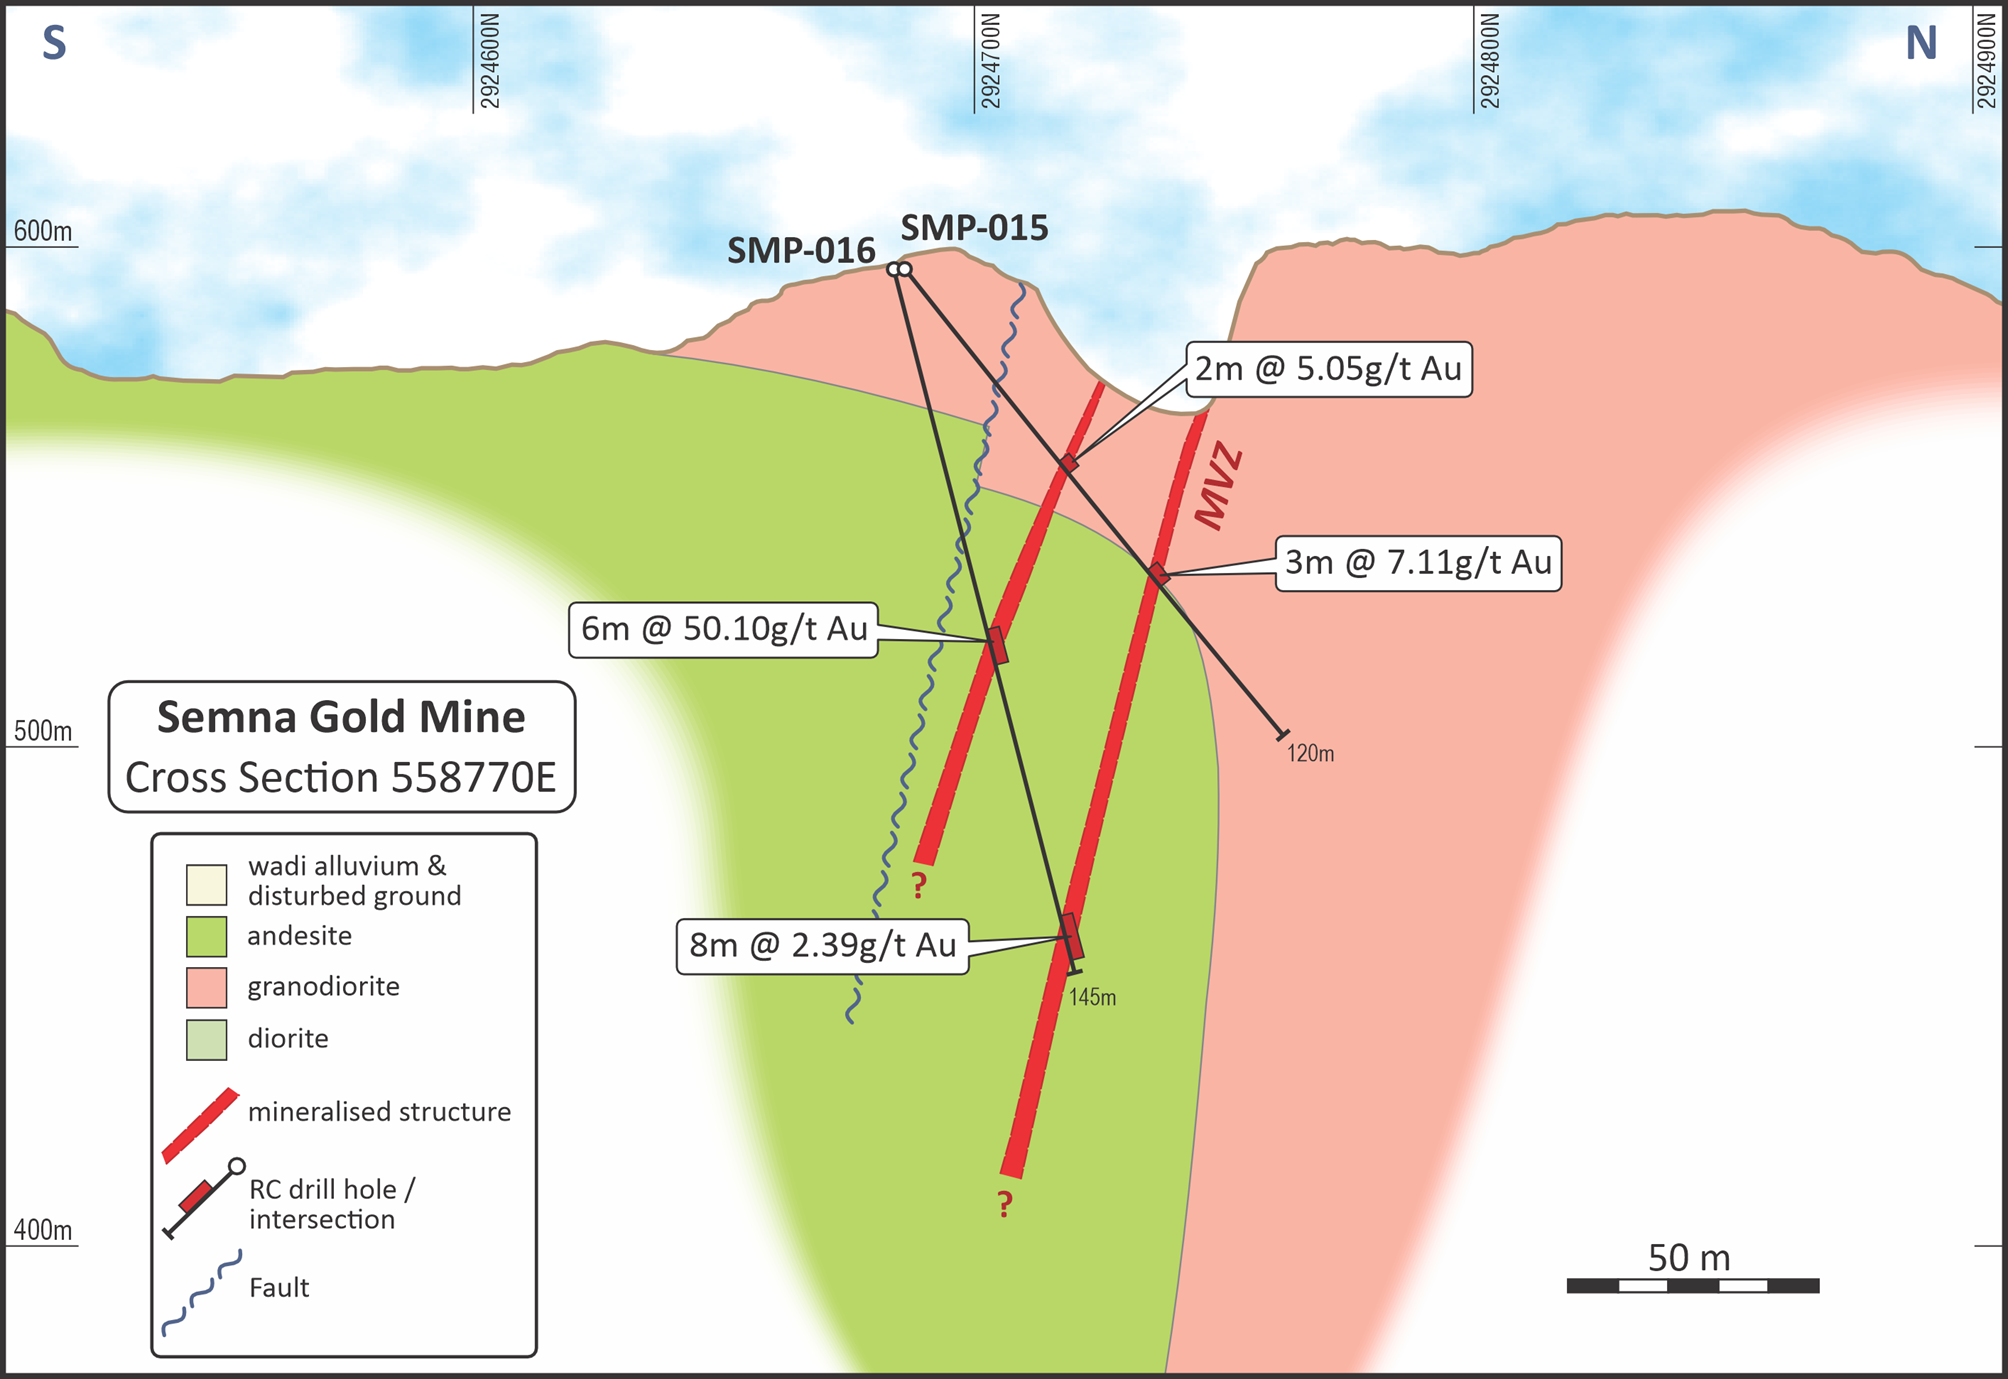
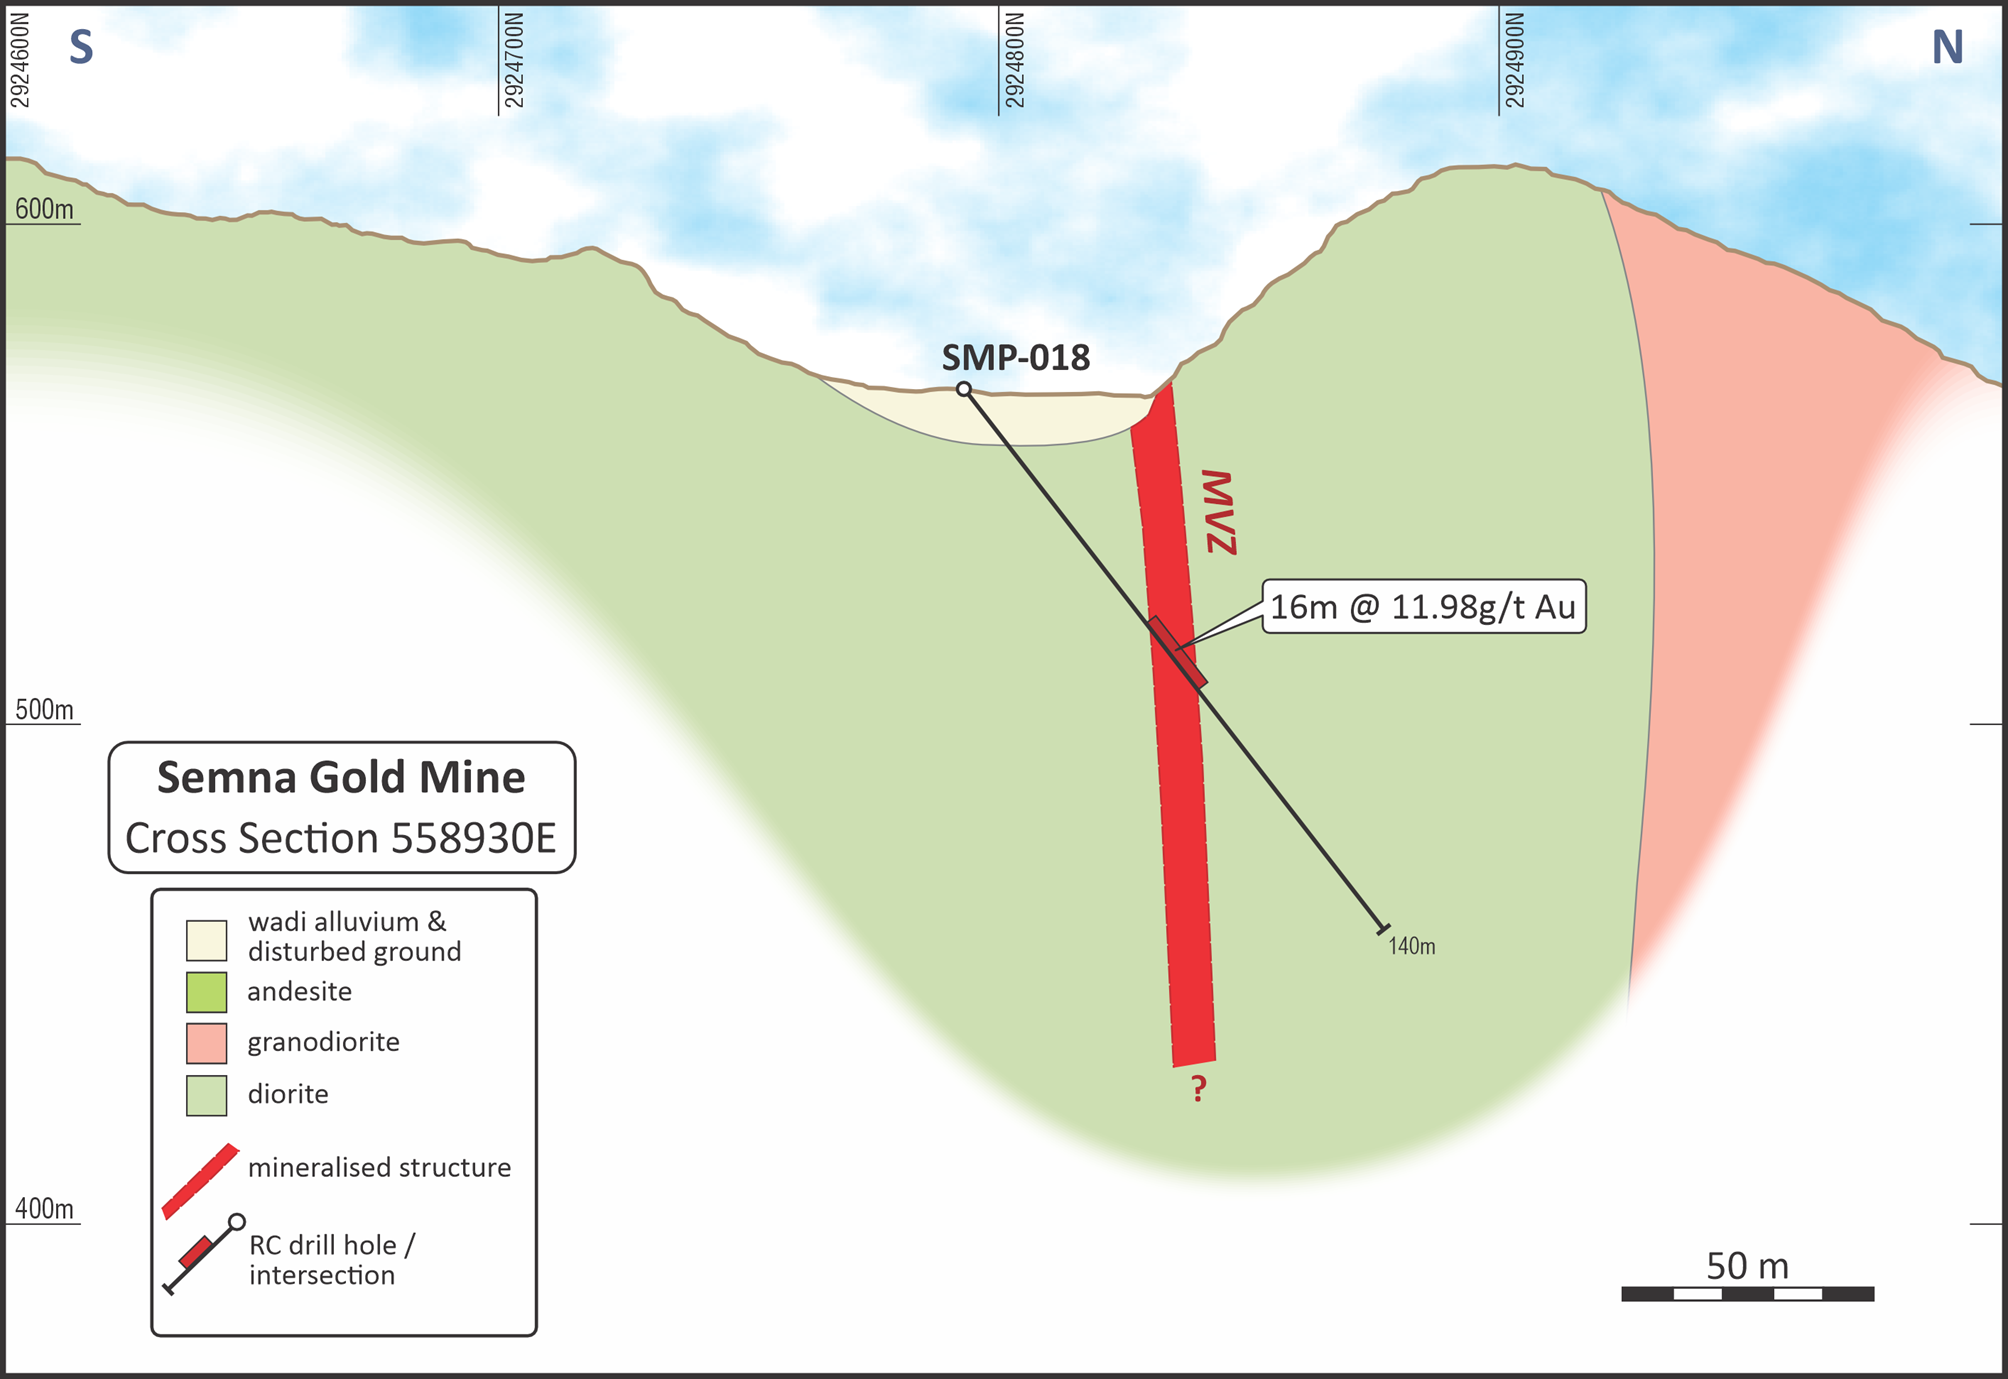
SOURCE: Aton Resources, Inc.
View the original press release on accesswire.com

