TORONTO, ON / ACCESSWIRE / January 9, 2024 / Signal Gold Inc. ("Signal Gold" or the "Company") (TSX:SGNL)(OTCQX:SGNLF) is pleased to announce additional diamond drill results from the Company's growth exploration program at its Goldboro Project in Nova Scotia ("Goldboro", or the "Project"). The diamond drill results, comprised of 2,382 metres of drilling in 13 diamond drill holes, targeted near surface gold mineralization to the west of and along strike from the Goldboro Deposit, specifically around the past producing Dolliver Mountain Gold Mine* ("Dolliver Mountain") (Exhibit A). This drilling is part of the larger growth exploration program that has now successfully tested a 1.1-kilometre strike extent of the Goldboro Trend, including the recently announced drill results that discovered gold mineralization up to 450 metres to the west of previous resource definition drilling.
"We continue to be pleased with the results of diamond drilling to the west and along strike from the Goldboro Deposit. The initial drilling at Dolliver Mountain has successfully intersected gold mineralization along a 200-metre strike extent and has now confirmed that the Goldboro mineralized system extends over one kilometre to the west of the Goldboro Deposit. These results also suggest significant potential in the down-plunge eastern projection beneath the Goldboro Deposit at depths greater than 550 vertical metres, in addition to immediate potential along strike to the east and west. We continue to demonstrate the potential scale of the Goldboro Deposit, with mineralization now outlined over a strike length of at least 3.4-kilometres, with further drill results pending that targeted the remaining strike extent between Dolliver Mountain and the Goldboro Deposit."
~ Kevin Bullock, President and CEO, Signal Gold Inc.
The most recent drill results from 13 diamond drill holes (BR-23-408 to 414, 416, 417, 419, 421, 427, and 428) included seven (7) instances of visible gold and 40 separate intersections of gold mineralization (Exhibits B and C) that are hosted within the same anticline which hosts the Goldboro Deposit. Selected composited highlights (core length) from the current drill holes include:
- 7.4 g/t gold over 1.1 metres (108.0 to 109.1 metres) in hole BR-23-412 including, 13.01 g/t gold over 0.6 metres;
- 12.73 g/t gold over 0.6 metres (92.9 to 93.5 metres) in hole BR-23-409;
- 10.02 g/t gold over 0.5 metres (118.9 to 119.4 metres) in hole BR-23-417; and
- 0.61 g/t gold over 6.0 metres (191.5 to 197.5 metres) in hole BR-23-410.
The initial drilling at Dolliver Mountain has demonstrated that, similar to the Goldboro Deposit, gold mineralization is hosted within multiple stacked argillite and quartz vein zones that are folded into an upright anticline that plunges gently to the east (approximately 20o). Gold mineralization is associated with increased alteration including pyrite and arsenopyrite, resulting in the Induced Polarization ("IP") chargeability high targeted during the current drill program. Drilling tested the host anticline to a vertical depth of 185 metres, and mineralization continues to be open to the west, east, and at depth. The intersection of gold mineralization at Dolliver Mountain also significantly demonstrates the potential for further discovery of gold down-plunge and beneath the Goldboro Deposit below 550 vertical metres (Exhibit D).
Assays are pending for an additional 19 drill holes totaling 3,813 metres from the growth exploration drill program, which are expected to be reported early in the first quarter of 2024.
*Operations began at the Dolliver Mountain Gold Mine in 1901 and the operation ceased in 1904.

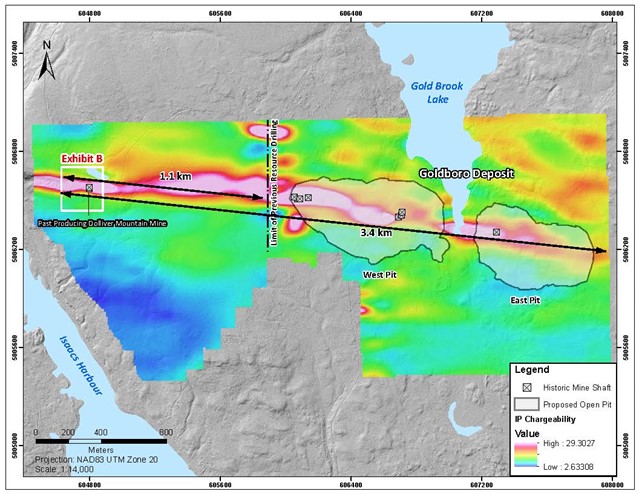
Exhibit A. A map showing the location of the conceptual West and East pits of the Goldboro Project and the location of the past producing Dolliver Mountain Gold Mine to the west. Also shown is the trend of the host structure of the Goldboro Deposit and its anticipated westerly extension as shown by a recently completed IP geophysical survey.

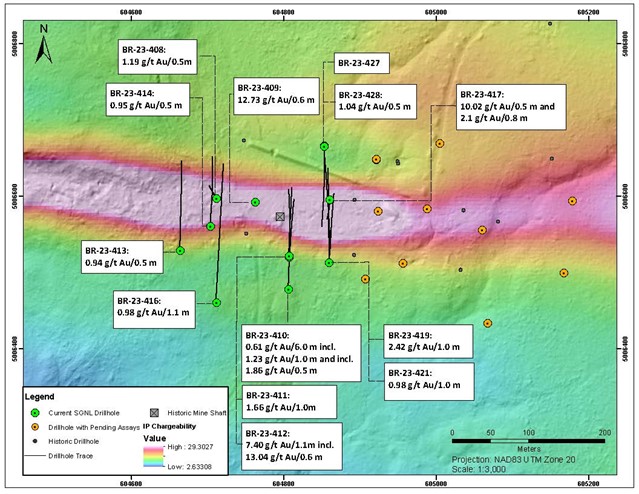
Exhibit B. A plan map showing the location of drill holes BR-23-408 to 414, 416, 417, 419, 421, 427, and 428, over a 200-metre strike extent surrounding the past-producing Dolliver Mountain Gold Mine, indicating gold mineralization at least 1.1 kilometres west of the Goldboro Deposit.

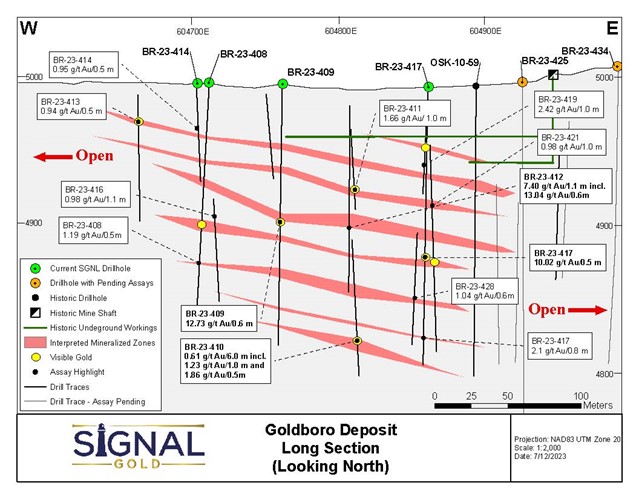
Exhibit C. A vertical longitudinal section through the west end of the Goldboro Deposit and including the area of recent diamond drilling. Drill results indicate that the structure that hosts the Goldboro Deposit and the same style of alteration and mineralization exist west of previous drill sections, demonstrating that the Deposit has the potential to be expanded westward. Potential mineralized belts are shown as currently interpreted.

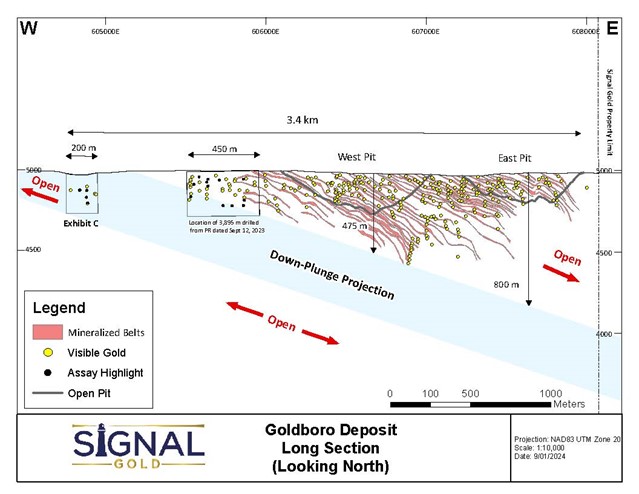
Exhibit D. A schematic vertical longitudinal section looking north, showing the 3.4-kilometre strike of known gold mineralization between Dolliver Mountain and the Goldboro Deposit. The drill results from Dolliver Mountain are significant in that they demonstrate potential for discovery of additional gold mineralization down-plunge to the east beneath the current Goldboro Deposit.
A table of selected composited assay results from the drill program
| Drill hole | From (m) | To (m) | Interval (m) | Gold (g/t) | Visible Gold |
| BR-23-408 | 36.2 | 37.2 | 1.0 | 0.99 | |
and | 53.0 | 53.6 | 0.6 | 0.97 | |
and | 95.3 | 97.1 | 1.8 | 0.59 | VG |
and | 99.7 | 101.6 | 1.9 | 0.68 | |
and | 124.9 | 125.4 | 0.5 | 1.19 | VG |
and | 159.0 | 159.5 | 0.5 | 0.74 | |
| BR-23-409 | 92.9 | 93.5 | 0.6 | 12.73 | VG |
and | 125.3 | 126.2 | 0.9 | 0.68 | |
| BR-23-410 | 126.8 | 127.4 | 0.6 | 0.92 | |
and | 179.2 | 179.8 | 0.6 | 0.68 | |
and | 182.4 | 183.0 | 0.6 | 1.04 | |
and | 191.5 | 197.5 | 6.0 | 0.61 | |
incl. | 192.0 | 193.0 | 1.0 | 1.23 | |
and incl. | 195.0 | 195.5 | 0.5 | 1.86 | |
and | 200.3 | 200.8 | 0.5 | 0.72 | |
and | 214.0 | 214.6 | 0.6 | 1.09 | |
| BR-23-411 | 84.7 | 85.7 | 1.0 | 0.80 | |
and | 96.3 | 97.3 | 1.0 | 1.66 | VG |
and | 112.6 | 113.2 | 0.6 | 0.85 | |
| BR-23-412 | 80.7 | 81.2 | 0.6 | 0.51 | |
and | 99.0 | 100.0 | 1.0 | 0.66 | |
and | 108.0 | 109.1 | 1.1 | 7.40 | |
incl. | 108.5 | 109.1 | 0.6 | 13.01 | |
and | 157.5 | 158.0 | 0.5 | 2.83 | |
| BR-23-413 | 29.8 | 30.3 | 0.5 | 0.94 | VG |
| BR-23-414 | 35.1 | 35.6 | 0.5 | 0.95 | |
and | 48.9 | 49.4 | 0.5 | 0.59 | |
| BR-23-416 | 117.3 | 118.4 | 1.1 | 0.98 | |
and | 201.2 | 201.7 | 0.5 | 0.98 | |
| BR-23-417 | 66.6 | 68.5 | 1.9 | 1.38 | |
incl. | 67.4 | 68.0 | 0.6 | 2.41 | |
and | 87.5 | 88.5 | 1.0 | 2.52 | |
and | 113.0 | 114.0 | 1.0 | 2.17 | |
and | 118.9 | 119.4 | 0.5 | 10.02 | |
and | 173.5 | 174.3 | 0.8 | 2.10 | |
| BR-23-419 | 46.0 | 46.5 | 0.5 | 0.53 | |
and | 48.8 | 49.8 | 1.0 | 0.81 | |
and | 70.5 | 71.5 | 1.0 | 2.42 | |
| BR-23-421 | 86.3 | 87.5 | 1.2 | 0.98 | |
and | 92.8 | 93.9 | 1.1 | 0.87 | |
and | 116.0 | 116.5 | 0.5 | 0.99 | |
and | 129.4 | 129.9 | 0.5 | 0.99 | VG |
and | 190.5 | 191.0 | 0.5 | 0.55 | VG |
| BR-23-428 | 171.4 | 171.9 | 0.5 | 1.04 |
Footnotes:
- Intervals are reported as core length only. True widths are estimated to be between 70% and 100% of the core length.
- All drill hole results are reported using fire assay only. See notes on QAQC procedures at the bottom of this press release.
- All drill holes not reported in the table above did not encounter significant mineralization.
- Drill holes were oriented along a north-south trend with holes on the north limb of the hosting anticlinal structure drilled southward and holes located south of the anticlinal structure drilled northward. The dip of holes is dependent upon the location relative to the anticline with the goal of intersecting mineralized zones orthogonally.
All samples and the resultant composites referred to in this release are collected using QA/QC protocols including the regular insertion of standards and blanks within the sample batch for analysis and check assays of select samples. All samples quoted in this release were analyzed at Eastern Analytical Ltd. in Springdale, NL, for Au by fire assay (30 g) with an AA finish.
All assays in this press release are reported as fire assays only. For samples analyzing greater than 0.5 g/t Au via 30 g fire assay, these samples will be re-analyzed at Eastern Analytical Ltd. via total pulp metallics. For the total pulp metallics analysis, the entire sample is crushed to -10mesh and pulverized to 95% -150mesh. The total sample is then weighed and screened to 150mesh. The +150mesh fraction is fire assayed for Au, and a 30 g subsample of the -150mesh fraction analyzed via fire assay. A weighted average gold grade is calculated for the final reportable gold grade. Total pulp metallics assays for drill holes sited within this press release may be updated in a future news release.
This news release has been reviewed and approved by Paul McNeill, P.Geo., VP Exploration with Signal Gold Inc., a "Qualified Person", under National Instrument 43-101 Standard for Disclosure for Mineral Projects.
ABOUT SIGNAL GOLD
Signal Gold is advancing the Goldboro Project in Nova Scotia, a significant growth project subject to a positive Feasibility Study which demonstrates an approximately 11-year open pit life of mine ("LOM") with average gold production of 100,000 ounces per annum and an average diluted grade of 2.26 grams per tonne gold. (Please see the 'NI 43-101 Technical Report and Feasibility Study for the Goldboro Gold Project, Eastern Goldfields District, Nova Scotia' on January 11, 2022, for further details). On August 3, 2022, the Goldboro Project received its environmental assessment approval from the Nova Scotia Minister of Environment and Climate Change, a significant regulatory milestone which enables the Company to commence site-specific permitting processes including the Industrial Approval and Crown Land Lease and Mining Lease applications. The Goldboro Project also has potential for further Mineral Resource expansion, particularly towards the west along strike and at depth. A future study will consider upgrading and expanding potentially mineable underground Mineral Resources as part of the longer-term mine development plan.
FOR ADDITIONAL INFORMATION CONTACT:
| Signal Gold Inc. Kevin Bullock President and CEO (647) 388-1842 kbullock@signalgold.com | Reseau ProMarket Inc. Dany Cenac Robert Investor Relations (514) 722-2276 x456 Dany.Cenac-Robert@ReseauProMarket.com |
SOURCE: Signal Gold Inc.
View the original press release on accesswire.com
