BUENOS AIRES, ARGENTINA / ACCESSWIRE / May 13, 2024 / Central Puerto S.A ("Central Puerto" or the "Company") (NYSE:CEPU), the largest private sector power generation companies in Argentina, reports its consolidated financial results for the First Quarter 2024 ("1Q24"), ended on March 31st, 2024.
A conference call to discuss the 1Q24 results will be held on May 13th, 2024, at 11 AM Eastern Time (see details below). All information provided is presented on a consolidated basis, unless otherwise stated.
Financial statements as of March 31st, 2024, include the effects of the inflation adjustment, applying IAS 29. Accordingly, the financial statements have been stated in terms of the measuring unit current at the end of the reporting period, including the corresponding financial figures for previous periods reported for comparative purposes. Growth comparisons refer to the same periods of the previous year, measured in the current unit at the end of the period, unless otherwise stated. Consequently, the information included in the Financial Statements for the period ended on March 31st, 2024, is not comparable to the Financial Statements previously published by the company. However, we presented some figures converted from Argentine Pesos to U.S. dollars for comparison purposes only. The exchange rate used to convert Argentine Pesos to U.S. dollars was the reference exchange rate (Communication "A" 3500) reported by the Central Bank for U.S. dollars for the end of each period. The information presented in U.S. dollars is for the convenience of the reader only and may defer in such conversion for each period is performed at the exchange rate applicable at the end of the latest period. You should not consider these translations to be representations that the Argentine Peso amounts actually represent these U.S. dollars amounts or could be converted into U.S. dollars at the rate indicated.
Definitions and terms used herein are provided in the Glossary at the end of this document. This release does not contain all the Company's financial information. As a result, investors should read this release in conjunction with Central Puerto's consolidated financial statements as of and for the period ended on March 31st, 2024, and the notes thereto, which will be available on the Company's website.
A. Regulatory Updates and Relevant Facts
Resolution SE N°9/2024
On February 8th, 2024, the Secretariat of Energy updated remuneration prices for energy and power of generation units not committed in a PPA. Remuneration values increased by 74% since February 1st, 2024.
Status on CAMMESA's delayed payments
On May 6 th, 2024, the Secretariat of Energy issued Resolution SE No. 58/2024, which determined the payment mechanism for trade receivables accrued on Dec-23, Jan-24 and Feb-24 that are still unpaid. The said payment mechanism stablishes that after each generator determines with CAMMESA the owed balances and an agreement between parties is signed, CAMMESA will proceed with payments as follows:
- Trade receivables accrued on December 2023 and January 2024 will be paid with Argentine Republic USD bond at face value (the AE38).
- Trade receivables accrued on February 2024 will be paid with funds available in CAMMESA's bank accounts and transfers made by the National Government to the Stabilization Fund.
The Company is analyzing the impacts of the Resolution and assessing all the necessary measures that could be taken to preserve its rights. As of the date of the Resolution, if the aforementioned mechanism was put in place, the Company would have an estimated economic loss of approximately ARS 24,450 million (USD 29 million), without including any default interest.
Acquisition of interest in AbraSilver
On April 22, 2024, our subsidiary Proener entered into a common shares subscription agreement with AbraSilver Resource Corp. (a Canadian company listed in the Canadian stock market) ("AbraSilver"), granting Proener a 4% interest in the share capital of AbraSilver, which is the owner of the silver-gold project Diablillos, located in the northeastern of Argentina. In turn, and in conjunction with Central Puerto, Kinross Gold Corporation, a major Canadian mining company, (NYSE:KGC)(TSX:K) also acquired a 4% interest on similar terms.
B. Argentine Market Overview
The table below sets forth key Argentine energy market data for 1Q24 compared to 4Q23 and 1Q23.
| 1Q24 | 4Q23 | 1Q23 | ? % 1Q24/1Q232 | ||||||||||||
Installed capacity (MW; EoP1) | 43,873 | 43,773 | 43,278 | 1% | |||||||||||
Thermal | 25,448 | 25,437 | 25,533 | 0% | |||||||||||
Hydro | 10,834 | 10,834 | 10,834 | 0% | |||||||||||
Nuclear | 1,755 | 1,755 | 1,755 | 0% | |||||||||||
Renewable | 5,836 | 5,747 | 5,156 | 13% | |||||||||||
Installed capacity (%) | 100% | 100% | 100% | N/A | |||||||||||
Thermal | 58% | 58% | 59% | (1 p.p.) | |||||||||||
Hydro | 25% | 25% | 25% | 0 p.p. | |||||||||||
Nuclear | 4% | 4% | 4% | 0 p.p. | |||||||||||
Renewable | 13% | 13% | 12% | 1 p.p. | |||||||||||
Energy Generation (GWh) | 39,285 | 34,865 | 38,629 | 2% | |||||||||||
Thermal | 21,355 | 14,168 | 23,418 | (9%) | |||||||||||
Hydro | 9,055 | 12,114 | 8,602 | 5% | |||||||||||
Nuclear | 3,225 | 2,811 | 1,889 | 71% | |||||||||||
Renewable | 5,650 | 5,772 | 4,720 | 20% | |||||||||||
Energy Generation (%) | 100% | 100% | 100% | N/A | |||||||||||
Thermal | 54% | 41% | 61% | (6 p.p.) | |||||||||||
Hydro | 23% | 35% | 22% | 1 p.p. | |||||||||||
Nuclear | 8% | 8% | 5% | 3 p.p. | |||||||||||
Renewable | 14% | 17% | 12% | 2 p.p. | |||||||||||
Energy Demand (GWh) | 37,884 | 33,258 | 39,496 | (4%) | |||||||||||
Residential | 18,289 | 14,700 | 19,429 | (6%) | |||||||||||
Commercial | 10,452 | 9,576 | 10,654 | (2%) | |||||||||||
Major Demand (Industrial/Commercial) | 9,143 | 8,982 | 9,413 | (3%) | |||||||||||
Energy Demand (%) | 100% | 100% | 100% | N/A | |||||||||||
Residential | 48% | 44% | 49% | (1 p.p.) | |||||||||||
Commercial | 28% | 29% | 27% | 1 p.p. | |||||||||||
Major Demand (Industrial/Commercial) | 24% | 27% | 24% | 0 p.p. |
Source: CAMMESA; company data.
- As of March 31st, 2024.
- Rounded.
Installed Power Generation Capacity: By the end of the first quarter of 2024 (1Q24), the country's installed capacity reached 43,873 MW, which means an increase of 1% or 595 MW compared to the 43,278 MW recorded as of March 31st, 2023. The growth in capacity was mainly due to: (i) the incorporation of 680 MW (+13%) from renewable sources, of which 378 MW corresponds to wind farms, 290 MW to solar photovoltaic projects and 12 MW to biogas power plants and (ii) a net decrease in thermal sources of 85 MW (-1%), which includes +397 MW of combined cycles and a decommission of 345 MW and 137 MW of gas turbines and diesel engines, respectively. All of these figures may include MW of new facilities and adjustments and repowering of power plants that were already in operation.
Power generation & demand: During the 1Q24, energy generation increased 2% to 39,285 GWh, compared to 38,629 GWh generated during the 1Q23. While thermal source continues to be the backbone of the Argentine electricity sector, this type of generation dropped 9% year-over-year (y/y) and its participation share in the energy matrix declined 6 p.p. y/y to 54%. Nuclear power plants generated 71% more y/y while their participation share in the energy matrix was 8%, followed by renewables (+20% of generation y/y) with a participation share of 14% and hydro (+5% generation y/y) with a participation share of 23%.
The demand of the 1Q24 dropped 4% vis-à-vis the 1Q23, prompted by a 6% decrease in residential consumption. But along the quarter, the demand and the supply behaviors changed as a result of shifts in temperatures and specific conditions of generation units.
During January 2024, the demand was lower than the same month of previous year due to basically lower residential demand on the back of low temperatures for the period (the average temperature for Great Buenos Aires + Litoral areas was equal to or lower than 26.1°, the historical mean for January in the interconnected system). Major users demand through distribution systems was also lower as a consequence of weak economic activity. Nuclear generation rose by 80% y/y, hydro by 42% y/y and renewables by 21% y/y. The growth in nuclear and hydro sources prompted lower thermal dispatch (-17% y/y). The high levels of supply boosted exports during the month.
By the end of January, temperatures began to rise. In February, demand grew by 8%, driven by a 12% increase in residential consumption (on February 1st, a new historical power demand peak was recorded: 29,572 MW). Hydro supply began to shrink by the mid of the quarter, so the demand was covered with an increase of nuclear generation (+59% y/y), renewable generation (+12% y/y), hydro generation (+8% y/y) and thermal generation (+8% y/y). Notwithstanding, imports were also needed.
During March 2024, generation and demand were lower than those recorded in March 2023 (-9% y/y and -15% y/y, respectively). The 1Q23 as a whole was exceptionally warmer than the 1Q24, especially March. During this month, nuclear generation increased by 73% y/y and renewables by 26% y/y. On the other hand, hydro generation decreased by 26% y/y and thermal dispatch declined by 14% y/y.
Finally, it is worth to mention that the increase in nuclear generation along the quarter was basically explained by the reincorporation of Atucha II power plant, which was in maintenance shutdown during the 1Q23. This power plant resumed operations in August 2023. Also, the lower thermal dispatch during the 1Q24 triggered lower alternative fuels consumption (-96% y/y of fuel oil and -83% y/y of diesel).
Energy Demand per type
(TWh)

Local energy Demand
(TWh)

C. Central Puerto S.A.: Main operating metrics
The table below sets forth key operating metrics of the Central Puerto group for 1Q24, compared to 4Q23 and 1Q23:

Source: CAMMESA; company data.
- On February 22, 2024, it was published in the Official Gazette of the Republic of Argentina, the request submitted by Central Costanera for the decommissioning of steam generation units COSTTV04 and COSTTV06, for a total installed capacity of 120 MW and 350 MW, respectively.
Thermal availability(1)(2)
(%)

Combined Cycles
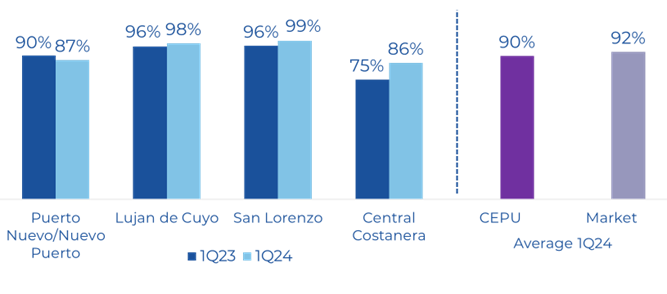
- Availability weighted average by power capacity. Off-time due to scheduled maintenance agreed with CAMMESA is not considered in the ratio.
- Central Costanera figures does not consider the power capacity values of the steam generation units COSTTV04 and COSTTV06
During 1Q24, Central Puerto's operated power generation increased by 8% to 5,520 GWh, compared to 5,122 GWh in 1Q23.
It should be noted that this increase includes the consolidation of the energy generated by Guañizuil II A solar plant (+82 GWh), acquired in October 2023, and Central Costanera (+714 GWh), acquired by mid- February 2023.
In 1Q24, hydro energy generation from Piedra del Aguila decreased 5% as compared with 1Q23 levels, reaching 807 GWh from 847 GWh, as a direct result of lower water availability for generation and a trend decreasing demand along the quarter.
With regards to renewables, energy generation increased 26% in 1Q24 compared to 1Q23, being mainly explained by the 82 GWh generated by Guañizuil II A solar plant and by a slightly higher wind generation as a result of higher wind resource during the period, which represented a 3% difference if compared to 1Q23.
Regarding thermal generation, it increased by 9% in 1Q24 compared to 1Q23, basically as a result of the acquisition of Central Costanera; the generation from this site represented 54% of our total thermal generation. It is worth to mention the performance of the Buenos Aires Combined Cycle, which rose its generation by 78% (+73 GWh) if compared to 1Q23, due to a deep maintenance and rehabilitation program put in place (this figures take into account that Central Costanera begun to be operated by Central Puerto by mid-February 2023). This was partially offset by lower dispatch and availability of some units.
Finally, steam production increased 9% during 1Q24, explained by a 2% increase in San Lorenzo cogeneration plant and a 16% increase in Lujan de Cuyo. The growth in the later case is basically explained by higher availability of gas turbines (maintenance finished by mid-2023, which highly improved operation performance since then).
D. 1Q24 Analysis of Consolidated Results
Important notice: The results presented for the 1Q24 are positively or negatively affected, as appropriate, by a non-cash effect, given by the fact that inflation rates were greater than currency depreciation rates during the quarter. Since the functional currency of Central Puerto is the Argentine peso, our Financial Statements are subject to inflation adjustment, while Company's figures are converted into US dollars using the end of period official exchange rate. Thus, given the significant disparity between inflation and devaluation for the period, it might affect comparability.
Main financial magnitudes of continuing operations (1)

- The FX rate used to convert Argentine Pesos to U.S. dollars is the reference exchange rate reported by the Central Bank (Communication "A" 3500) as of March 31st 2024 (AR$857.42 to US$1.00)
- See "Disclaimer-EBITDA & Adjusted EBITDA" on page 19 for further information.
During 1Q24, revenues totaled US$150 million increasing 15% compared to US$130 million in the 1Q23.

This was mainly due to a combination of:
| (i) | A 14% or US$9 million increase in Spot/Legacy energy sales which amounted to US$73 million in 1Q24 compared to US$64 million in the 1Q23, driven by a combination of the consolidation of Central Costanera's revenues which contributed with sales of US$24 million, partially offset by a lower remuneration measured in US dollars and a lower dispatch of some units (thermal ex Central Costanera). | |
| (ii) | A 16% or US$9 million increase in sales under contracts, which totaled US$65 million in 1Q24 compared to US$56 million in 1Q23, mainly explained by the recent acquisition of the solar farm Guañizuil II A, which contributed with sales of US$4 million in the quarter, and higher sales of cogeneration units. Sales of wind farms were slightly higher due to higher wind resource. | |
| (iii) | A 229% or US$3 million increase in Forestry revenues as a result of EVASA group acquisition on May 2023. | |
| (iv) | A positive non-cash effect on the gap between currency devaluation and inflation. |
Operating cost, excluding depreciation and amortization, in 1Q24 amounted to US$59 million, increasing by 14% or US$7 million when compared to US$52 million in 1Q23.
Production costs rose primarily due to: (i) higher employee compensations; (ii) energy and power purchases; (iii) maintenance expenses and (iv) consumption of materials and spare parts, being all driven by CECO acquisition. Production cost were also negatively impacted by a non-cash effect on the gap between currency devaluation and inflation.
In addition, SG&A, excluding depreciations and amortizations, increased by 34% or US$4 million in the quarter basically as a result of: (i) higher compensations to employees, (ii) fees and compensation for services and taxes, all driven by CECO acquisition. As previously stated, the non-cash effect on the gap between currency devaluation and inflation also fueled SG&A
Other operating results net (excluding FONI and variation of biological assets) in 1Q24 were positive in US$7 million, diminishing 18% or US$2million compared to 1Q23. This is mainly explained by (i) lower interest from clients and (ii) a negative non-cash effect on the gap between currency devaluation and inflation.
Consequently, Consolidated Adjusted EBITDA ([1]) amounted to US$84 million in 1Q24, compared to US$76 million in 1Q23.
Consolidated Net financial results in 1Q24 were negative in US$21 million compared to a loss of US$38 million in 1Q23, which means an improve of US$ 16 million. This was mainly driven by lower foreign exchange differences on financial liabilities and lower bank commissions, being all partially offset by a negative result from the variation in the fair value of financial assets.
Loss on net monetary position in 1Q24 measured in US dollars amounted to US$6 million being 88% lower than the US$49 million loss in 1Q23, driven by the impact of the higher inflation of the period on a lower balance of monetary assets in Argentine pesos.
Profit/Loss on associate companies was negative on US$4 million compared to a US$4 million loss in 1Q23.
Income tax in 1Q24 was negative in US$21million compared to, also negative, US$7 million in 1Q23 due to basically a higher income before tax.
Finally, Net Income in 1Q24 amounted to US$32million, compared to US$1 million of 1Q23.
Adjusted EBITDA Reconciliation (1)
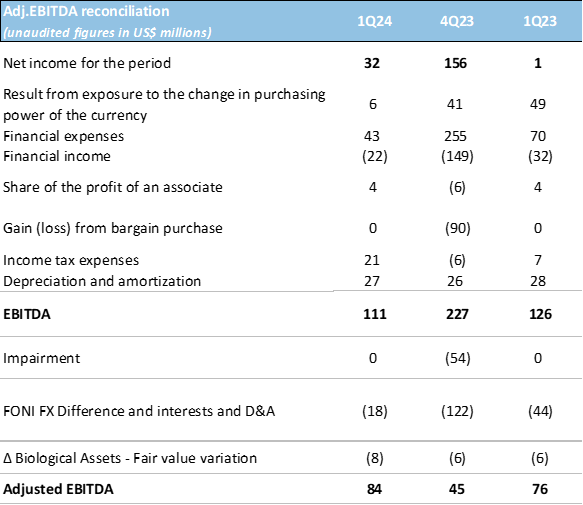
([1]) See "Disclaimer-EBITDA & Adjusted EBITDA" on page 19 for further information.
Financial Situation
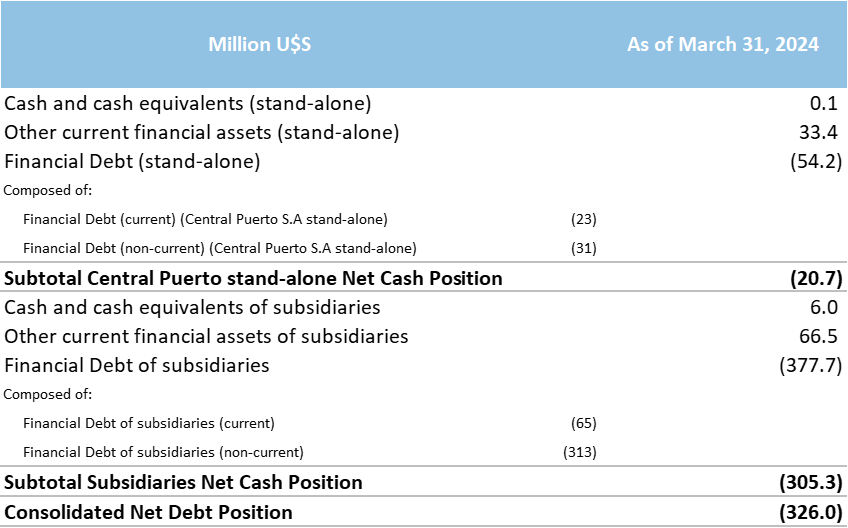
As of March 31st, 2024, the Company and its subsidiaries had Cash and Cash Equivalents of US$6million, and Other Current Financial Assets of US$100 million.
The following chart breaks down the Net Debt position of Central Puerto (on a stand-alone basis) and its subsidiaries:
Cash Flows of 1Q24
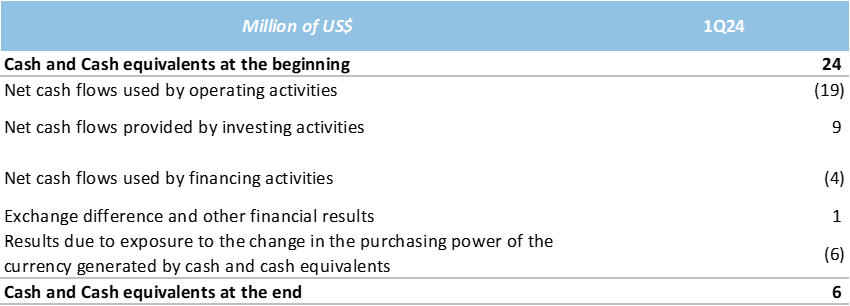
Net cash used by operating activities was US$18.6 million during 1Q24. This cash flow arises mainly from (i) US$53.1 million of net income for the period before income tax; (ii) US$10.1 million in collection of interest from clients, (iii) adjustments to reconcile profit for the period before income tax with net cash flows of US$54.2 million; being all partially offset by; (iv) US$128.8 million in negative working capital variations (account payables, account receivables, inventory and other non-financial assets and liabilities); (v) Income tax payments of US$7.3 million.
Net cash provided by investing activities was US$9.3 million during 1Q24. This amount is mainly explained by (i) US$27.7 million investments in property, plant, equipment and inventory, being all offset by (ii) US$4.4 million in dividends collected and (iii) US$32.6 million in sale of financial assets net.
Net cash used by financing activities was negative in US$3.7 million in the 1Q24. This is basically the result of (i) US$30.7 million in debt service amortizations; (ii) US$9.5 million in interest and other financing costs related to long-term loans, and (v) US$12.0 million in dividends paid, being all partially offset by US$28.9 million in financing obtained in the period and (iv) US$19.6 million in overdrafts in checking accounts.
The following table shows the company's principal maturity profile as of March 31, 2024, expressed in millions of dollars.
Debt Maturity schedule(1)(2)
(US$ mm.)
(%)
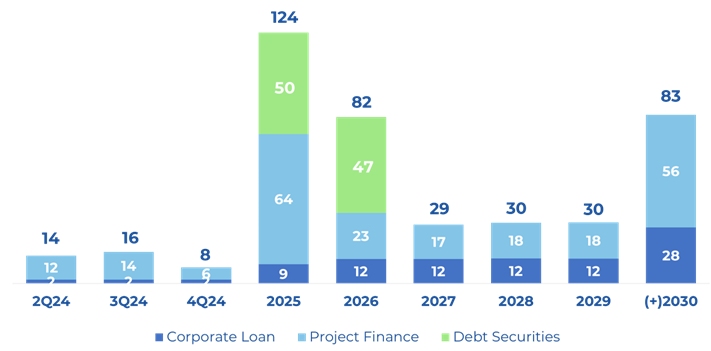
- As of March 31st, 2024.
- Considers only principal maturities. Does not considering accrued interest.
E. Tables
a. Consolidated Statement of Income
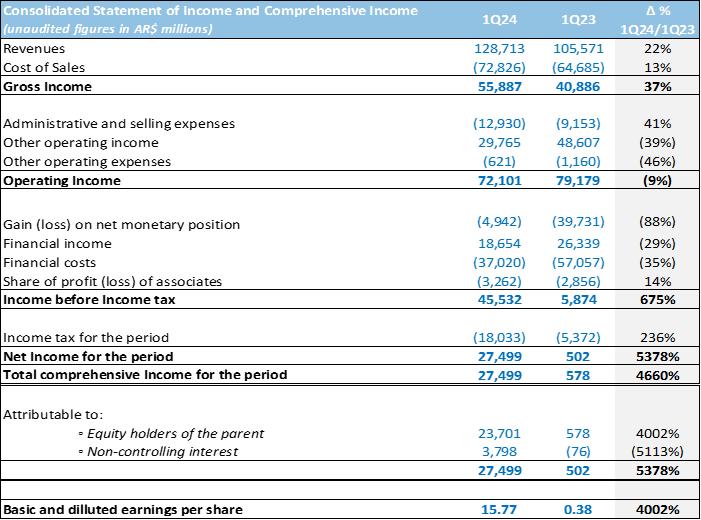
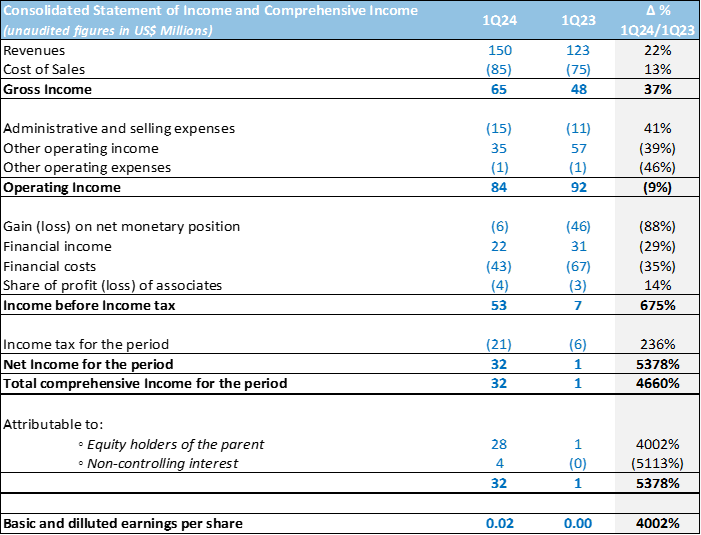
The exchange rate used to convert Argentine Pesos to U.S. Dollars is the reference exchange rate (Communication "A" 3500) reported by the Central Bank for U.S. Dollars as of March 31, 2024 of AR$ 857.42 per US$ 1.00.
b. Consolidated Statement of Financial Position
The exchange rate used to convert Argentine Pesos to U.S. Dollars is the reference exchange rate (Communication "A" 3500) reported by the Central Bank for U.S. Dollars as of March 31, 2024 of AR$ 857.42 per US$ 1.00.
c. Consolidated Statement of Cash Flow
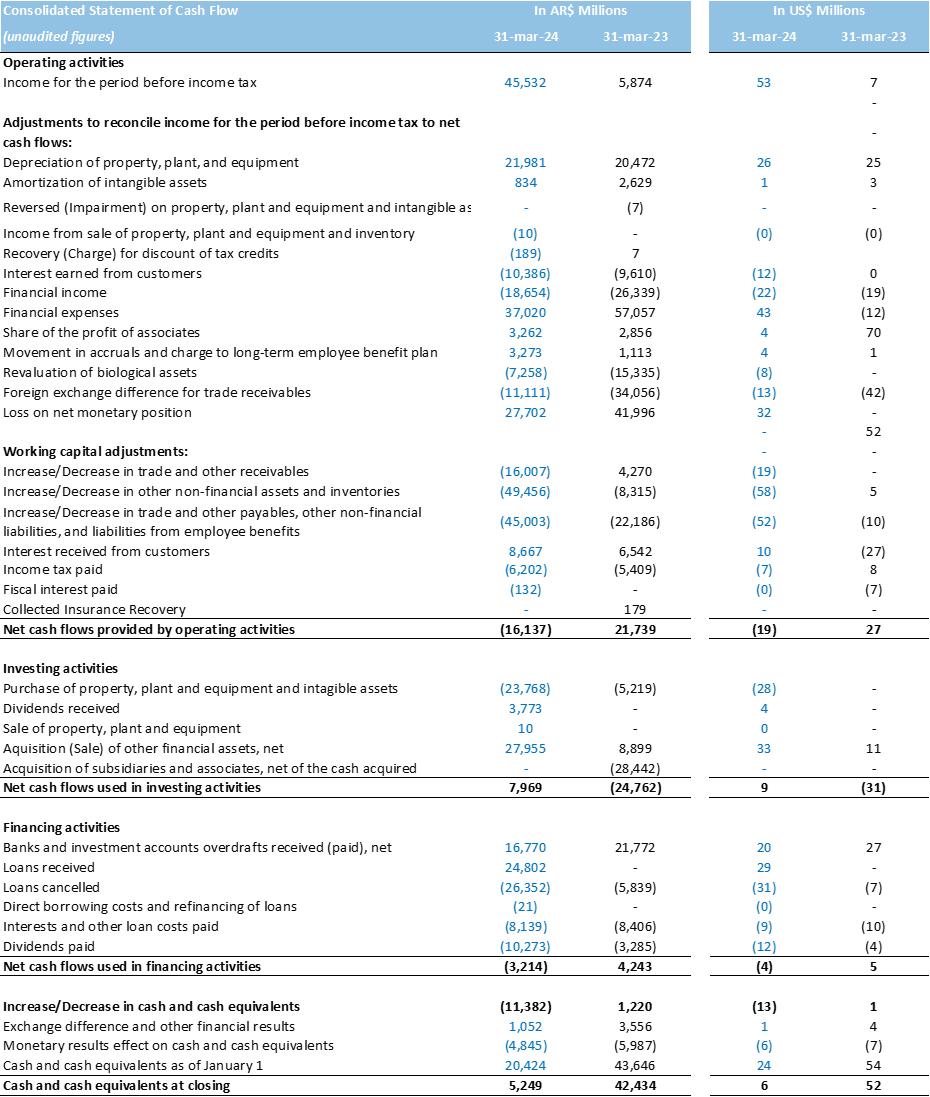
The exchange rate used to convert Argentine Pesos to U.S. Dollars is the reference exchange rate (Communication "A" 3500) reported by the Central Bank for U.S. Dollars as of March 31, 2024 of AR$ 857.42 per US$ 1.00.
F. Information about the Conference Call
There will be a conference call to discuss Central Puerto's 1Q 2024 results on May 13, 2024, at 11:00 AM Eastern Time.
The conference will be hosted by Mr. Fernando Bonnet, Chief Executive Officer and Enrique Terraneo, Chief Financial Officer.
To access the conference call, please dial:
Toll Free: +1 888-506-0062
International: + 1 973-528-0011
Participant Access Code: 725538
Webcast URL: https://www.webcaster4.com/Webcast/Page/2629/50566
The Company will also host a live audio webcast of the conference call on the Investor Relations section of the Company's website at www.centralpuerto.com. Please allow extra time prior to the call to visit the website and download any streaming media software that might be required to listen to the webcast. The call will be available for replay on the Company's website under the Investor Relations section.
You may find additional information on the Company at:
- http://investors.centralpuerto.com/
- www.sec.gov
- www.cnv.gob.ar
Glossary
In this release, except where otherwise indicated or where the context otherwise requires:
- "BCRA" refers to Banco Central de la República Argentina, Argentina's Central Bank,
- "CAMMESA" refers to Compañía Administradora del Mercado Mayorista Eléctrico Sociedad Anónima;
- "COD" refers to Commercial Operation Date, the day in which a generation unit is authorized by CAMMESA (in Spanish, "Habilitación Comercial") to sell electric energy through the grid under the applicable commercial conditions;
- "Ecogas" refers collectively to Distribuidora de Gas Cuyana ("DGCU"), Distribuidora de Gas del Centro ("DGCE"), and their controlling company Inversora de Gas del Centro ("IGCE");
- "Energía Base" (legacy energy) refers to the regulatory framework established under Resolution SE No. 95/13, as amended, currently regulated by Resolution SE No. 9/24;
- "FONINVEMEM" or "FONI", refers to the Fondo para Inversiones Necesarias que Permitan Incrementar la Oferta de Energía Eléctrica en el Mercado Eléctrico Mayorista (the Fund for Investments Required to Increase the Electric Power Supply) and Similar Programs, including Central Vuelta de Obligado (CVO) Agreement;
- "p.p.", refers to percentage points;
- "PPA" refers to power purchase agreements.
Disclaimer
Rounding amounts and percentages: Certain amounts and percentages included in this release have been rounded for ease of presentation. Percentage figures included in this release have not in all cases been calculated on the basis of such rounded figures, but on the basis of such amounts prior to rounding. For this reason, certain percentage amounts in this release may vary from those obtained by performing the same calculations using the figures in the financial statements. In addition, certain other amounts that appear in this release may not sum due to rounding.
This release contains certain metrics, including information per share, operating information, and others, which do not have standardized meanings or standard methods of calculation and therefore such measures may not be comparable to similar measures used by other companies. Such metrics have been included herein to provide readers with additional measures to evaluate the Company's performance; however, such measures are not reliable indicators of the future performance of the Company and future performance may not compare to the performance in previous periods.
OTHER INFORMATION
Central Puerto routinely posts important information for investors in the Investor Relations support section on its website, www.centralpuerto.com. From time to time, Central Puerto may use its website as a channel of distribution of material Company information. Accordingly, investors should monitor Central Puerto's Investor Relations website, in addition to following the Company's press releases, SEC filings, public conference calls and webcasts. The information contained on, or that may be accessed through, the Company's website is not incorporated by reference into, and is not a part of, this release.
CAUTIONARY STATEMENTS RELEVANT TO FORWARD-LOOKING INFORMATION
This release contains certain forward-looking information and forward-looking statements as defined in applicable securities laws (collectively referred to in this Earnings Release as "forward-looking statements") that constitute forward-looking statements. All statements other than statements of historical fact are forward-looking statements. The words "anticipate', "believe', "could', "expect', "should', "plan', "intend', "will', "estimate' and "potential', and similar expressions, as they relate to the Company, are intended to identify forward-looking statements.
Statements regarding possible or assumed future results of operations, business strategies, financing plans, competitive position, industry environment, potential growth opportunities, the effects of future regulation and the effects of competition, expected power generation and capital expenditures plan, are examples of forward-looking statements. Forward-looking statements are necessarily based upon a number of factors and assumptions that, while considered reasonable by management, are inherently subject to significant business, economic and competitive uncertainties, and contingencies, which may cause the actual results, performance, or achievements of the Company to be materially different from any future results, performance or achievements expressed or implied by the forward-looking statements.
The Company assumes no obligation to update forward-looking statements except as required under securities laws. Further information concerning risks and uncertainties associated with these forward-looking statements and the Company's business can be found in the Company's public disclosures filed on EDGAR (www.sec.gov).
EBITDA & ADJUSTED EBITDA
In this release, EBITDA, a non-IFRS financial measure, is defined as net income for the period, plus finance expenses, minus finance income, minus share of the profit (loss) of associates, plus (minus) losses (gains) on net monetary position, plus income tax expense, plus depreciation and amortization, minus net results of discontinued operations.
Adjusted EBITDA refers to EBITDA excluding impairment on property, plant & equipment, foreign exchange difference and interests related to FONI trade receivables and variations in fair value of biological asset.
Adjusted EBITDA is believed to provide useful supplemental information to investors about the Company and its results. Adjusted EBITDA is among the measures used by the Company's management team to evaluate the financial and operating performance and make day-to-day financial and operating decisions. In addition, Adjusted EBITDA is frequently used by securities analysts, investors, and other parties to evaluate companies in the industry. Adjusted EBITDA is believed to be helpful to investors because it provides additional information about trends in the core operating performance prior to considering the impact of capital structure, depreciation, amortization, and taxation on the results.
Adjusted EBITDA should not be considered in isolation or as a substitute for other measures of financial performance reported in accordance with IFRS. Adjusted EBITDA has limitations as an analytical tool, including:
- Adjusted EBITDA does not reflect changes in, including cash requirements for, working capital needs or contractual commitments;
- Adjusted EBITDA does not reflect the finance expenses, or the cash requirements to service interest or principal payments on indebtedness, or interest income or other finance income;
- Adjusted EBITDA does not reflect income tax expense or the cash requirements to pay income taxes;
- although depreciation and amortization are non-cash charges, the assets being depreciated or amortized often will need to be replaced in the future, and Adjusted EBITDA does not reflect any cash requirements for these replacements;
- although share of the profit of associates is a non-cash charge, Adjusted EBITDA does not consider the potential collection of dividends; and
- other companies may calculate Adjusted EBITDA differently, limiting its usefulness as a comparative measure.
The Company compensates for the inherent limitations associated with using Adjusted EBITDA through disclosure of these limitations, presentation of the Company's consolidated financial statements in accordance with IFRS and reconciliation of Adjusted EBITDA to the most directly comparable IFRS measure, net income. For a reconciliation of the net income to Adjusted EBITDA, see the tables included in this release.
Contact information:
Chief Financial Officer
Enrique Terraneo
- Tel:
(+54 11) 4317 5000 - Email: inversores@centralpuerto.com
- Investor Relations Website:
https://investors.centralpuerto.com/
SOURCE: Central Puerto S.A.
View the original press release on accesswire.com
