


LUXEMBOURG / ACCESS Newswire / February 18, 2025 / Ternium S.A. (NYSE:TX) today announced its results for the fourth quarter and full year ended December 31, 2024.
The financial and operational information contained in this press release is based on Ternium S.A.'s operational data and consolidated condensed financial statements prepared in accordance with International Financial Reporting Standards (IFRS) and presented in US dollars ($) and metric tons. This press release includes certain non-IFRS alternative performance measures such as Adjusted EBITDA, Cash Operating Income, Adjusted Net Income, Adjusted Equity Holders' Net Income, Adjusted Earnings per ADS, Free Cash Flow and Net Cash. The reconciliation of these figures to the most directly comparable IFRS measures is included in Exhibit I.
Fourth Quarter of 2024 Highlights
Summary of Fourth Quarter and Full Year 2024 Results
Fourth Quarter and Full Year 2024 Highlights
The Mexican steel market experienced a downturn in the fourth quarter of 2024, due to year-end seasonality and a weakened commercial market. This weakness was partly influenced by uncertainties arising from the change in government administration in both Mexico and the United States, as well as heightened rhetoric from the U.S. on trade measures. Despite this, for the full year 2024 steel sales volumes in Mexico remained relatively stable, as the weakness in the commercial market was largely offset by continued growth of Ternium's steel shipments to industrial customers.
The Brazilian steel market softened in the fourth quarter, largely due to year-end seasonality. For the full year 2024, Usiminas successfully capitalized on an increased local demand for steel products, despite facing substantial steel imports into Brazil, aided by an improved operating performance. With Ternium fully consolidating Usiminas' results from July 2023 onwards, reported steel shipments for 2024 saw a significant increase compared to those of 2023.
In the Southern Region, steel sales volumes in the fourth quarter of 2024 reflected a seasonal demand decline in Argentina. For the full year 2024, the company experienced a 20% decrease in steel shipments in the Southern Region primarily in connection with the Argentine government's economic stabilization measures, which had a significant impact in the first quarter followed by a gradual improvement throughout the year.
In Other Markets, steel shipments in the fourth quarter reflected a decrease in sales volumes in the US. For the full year 2024, steel sales volumes improved across the board following a relatively weak performance in the prior year.
Ternium's realized steel prices continued to decline in the fourth quarter of 2024. The company's steel cost per ton also fell, although it lagged behind the reduction in raw material and slab market prices as the company consumed previously purchased higher-priced inventories. For the full year 2024, realized steel prices decreased by $116 year-over-year. This decline was partially offset by a decrease in steel cost per ton.
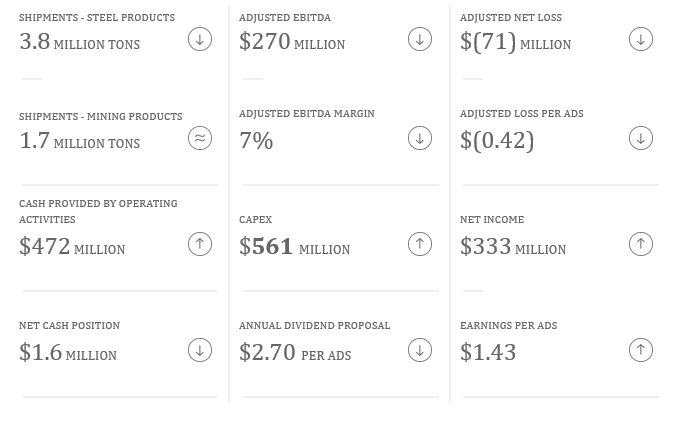
Ternium's net income totaled $333 million in the fourth quarter of 2024. The company recorded a $404 million provision reversal for ongoing litigation related to the acquisition of a participation in Usiminas in 2012. Excluding this provision reversal, Adjusted Net Loss was $71 million. For the full year 2024, Ternium's net income totaled $174 million. During the year, the company recorded a net $410 million provision for the aforementioned litigation. Excluding this provision, Adjusted Net Income for 2024 was $584 million.
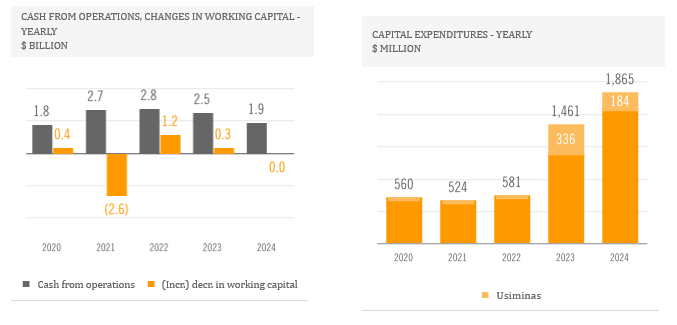
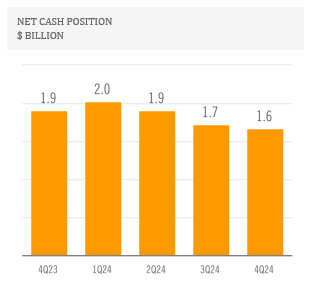
In 2024, dividends paid to the company's shareholders amounted to $609 million. Capital expenditures for the year reached $1.9 billion, showcasing Ternium's progress in expanding its industrial center in Pesquería, Mexico, and the construction of a new wind farm in Argentina, which was inaugurated by the end of the year. Despite these significant cash disbursements, the company's net cash position at the end of 2024 was $1.6 billion. Strong operating cash flow of $1.9 billion and a $457 million increase in the fair value of financial instruments helped maintain this solid financial position.
Annual Dividend Proposal

Ternium's board of directors proposed an annual dividend of $2.70 per ADS ($0.27 per share), or $530 million based on total shares of common stock outstanding net of treasury shares, be approved at the company's annual general shareholders' meeting, which is scheduled to be held on May 6, 2025. Based on current market price of Ternium's ADS, the proposed annual dividend is equivalent to a dividend yield of 9%.
The annual dividend would include the interim dividend of $0.90 per ADS ($0.09 per share), or $177 million, paid in the fourth quarter. If the board of directors' proposal is approved at the shareholders' meeting, a net dividend of $1.80 per ADS ($0.18 per share), or $353 million, will be paid on May 14, 2025, with record date on May 9, 2025.
Outlook
Ternium expects a slight sequential increase in adjusted EBITDA for the first quarter of 2025 driven by improved margins and shipments, with volume recovery in Brazil and stable shipments in Mexico and Argentina. The company anticipates that cost per ton will decrease in the first quarter due to the gradual consumption of lower-priced slabs and raw material inventories, while a sequentially lower revenue per ton is expected to partially offset this cost reduction.
The recent surge in US trade action is creating significant uncertainty in global markets. Within Ternium's markets, the company anticipates that this development will continue to affect Mexico's apparent steel demand until a definitive understanding of the final measures is achieved.
Ternium's new push-pull pickling line at the Pesquería industrial center along with four lines in the new finishing center, all part of the company's downstream expansion project in Mexico, continue to progress in their ramp-up process. Ternium expects to start-up the remainder of the lines in this project, a cold rolling mill and a hot-dip galvanizing line, by the end of the year.
The company's newly built wind farm in Argentina commenced electricity generation in December 2024. All of the 22 wind turbines have already been installed. Upon full operation, the wind farm is projected to produce approximately 480 GWh annually, mostly offsetting the company's procurement of third-party electricity in the country. This initiative provides substantial economic benefits and assists the company in achieving its decarbonization goals.
Analysis of Fourth Quarter and Full Year of 2024 Results
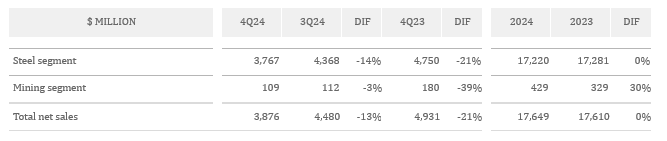
Consolidated Net Sales
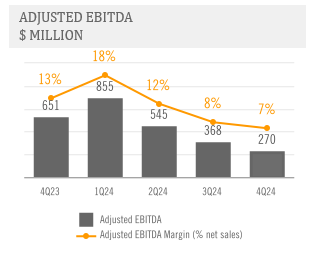
Adjusted EBITDA
Depreciation and amortization;
Income tax results;
Net financial result;
Equity in earnings of non-consolidated companies;
Provision reversal for ongoing litigation related to the acquisition of a participation in Usiminas; and
Impairment of Las Encinas' mining assets.
And adjusted to include the proportional EBITDA in Unigal (70% participation).
Adjusted EBITDA Margin equals Adjusted EBITDA divided by net sales. For more information see Exhibit I - Alternative performance measures - "Adjusted EBITDA".
Steel Segment Fourth Quarter of 2024 Results
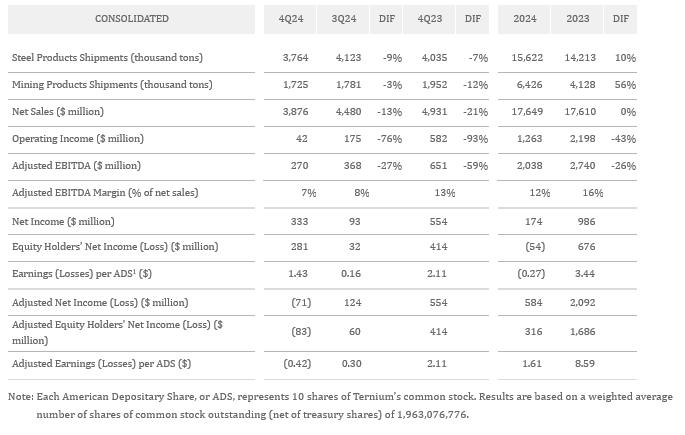
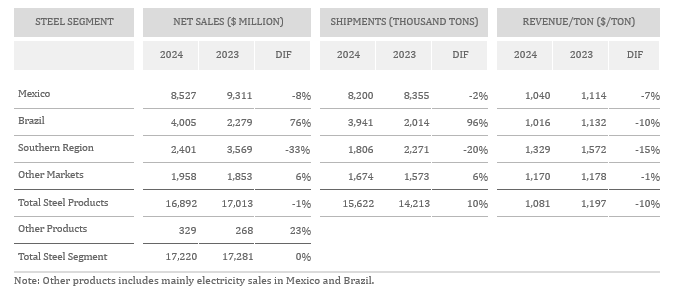
In the fourth quarter of 2024, the Steel Segment's shipments and net sales decreased sequentially by 9% and 14%, respectively. This decline primarily reflects a seasonal activity slowdown, along with a drop in Mexican commercial market demand. Additionally, realized steel prices fell across all of Ternium's markets. On a year-over-year basis, the fourth quarter Steel Segment's shipments and net sales dropped by 7% and 21%, respectively. Sales volumes saw a slight increase in Brazil but declined in other steel markets. Steel prices experienced a year-over-year decrease in all markets.

In Mexico, steel shipments decreased sequentially in the fourth quarter of 2024 due to seasonally lower demand and a weaker commercial market. Compared to the prior-year fourth quarter, shipments also decreased, as the softness in the commercial market was partially offset by the continued growth in Ternium's sales volumes to industrial customers.
In Brazil, shipments declined sequentially in the fourth quarter primarily due to seasonally lower steel demand. However, year-over-year, sales volumes in this period showed a slight improvement.
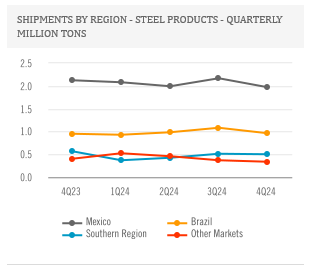
In the Southern Region, steel shipments decreased sequentially in the fourth quarter reflecting seasonally lower demand. In a year-over-year comparison, sales volumes decreased in the period due to the negative impact on activity of the Argentine government's economic stabilization measures.
In Other Markets, sales volumes decreased in the fourth quarter on a sequential and year-over-year basis. The decline was primarily due to lower shipments in the US market.
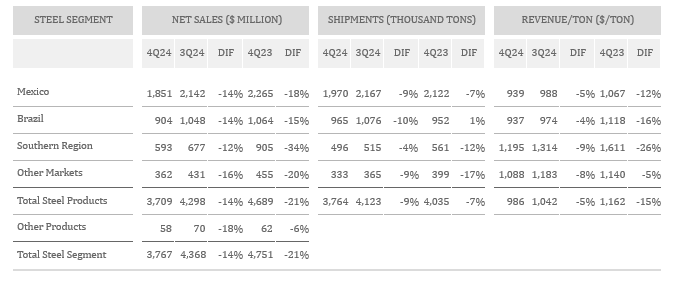
The Steel Segment's Cash Operating Income per Ton and Margin decreased both sequentially and year-over-year in the fourth quarter of 2024. In this period, revenue per ton decreased by $57 sequentially and by $177 compared with the prior-year fourth quarter. These declines were partially offset by a decrease in cost per ton of steel, which, however, continued to lag behind the reduction in raw material and slab market prices.
In addition, the year-over-year decrease in the cost per ton of steel reflected incremental efficiency gains achieved at Usiminas' blast furnace operations.
Steel Segment Full Year 2024 Shipments and Net Sales
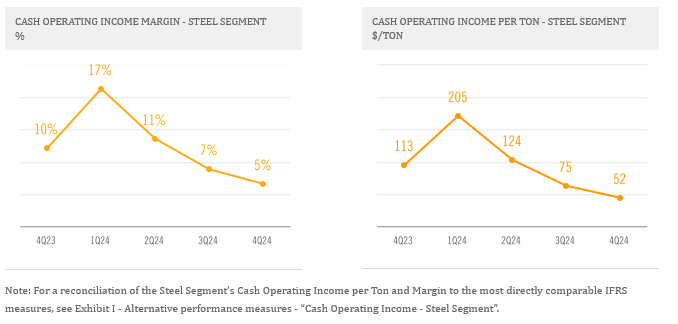
The Steel Segment's net sales in 2024 experienced a slight decline compared to 2023. Realized steel prices decreased by 10% year-over-year reflecting the overall market trend. This decline was mostly offset by an increase in reported shipments, primarily due to the full consolidation of Usiminas' results partially offset by lower sales volumes in the Southern Region.
In Mexico, sales volumes remained relatively stable year-over-year in 2024. The weakness in the country's commercial steel market was largely offset by sustained growth in Ternium's shipments to industrial customers. Over the past few years, shipments in Mexico have increased significantly.
In Brazil, shipments increased in 2024 due to the full year consolidation of Usiminas' results. Additionally, sales volumes in the country were bolstered by Usiminas' enhanced operating performance and stronger local demand for steel products.
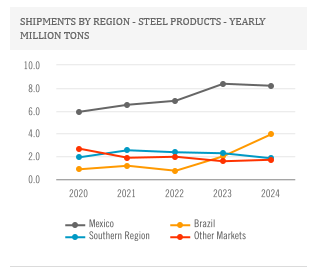
In the Southern Region, shipments experienced a significant decrease reflecting the Argentine government's economic stabilization measures, which had a significant impact in the first quarter followed by a gradual improvement throughout the year.
In Other Markets, sales volumes improved in 2024, albeit starting from relatively weak shipments in 2023.
Mining Segment Fourth Quarter of 2024 Results
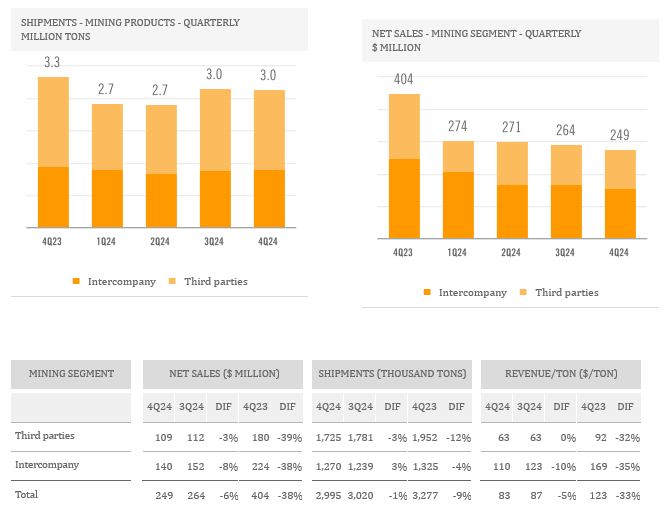
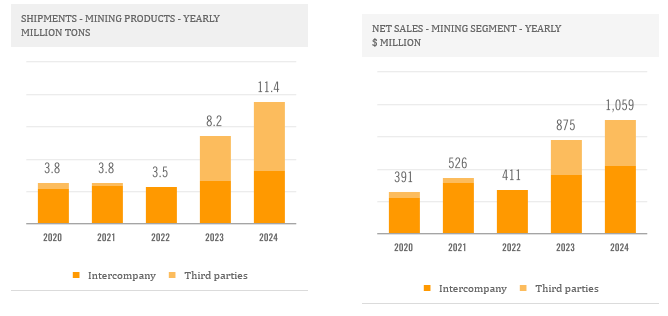
In the fourth quarter of 2024, the Mining Segment's net sales decreased sequentially by 6%. On a sequential basis, the Mining Segment's shipments remained stable. However, on a year-over-year basis, shipments decreased by 9% in the fourth quarter, primarily due to lower production levels in our Mexican and Brazilian operations.
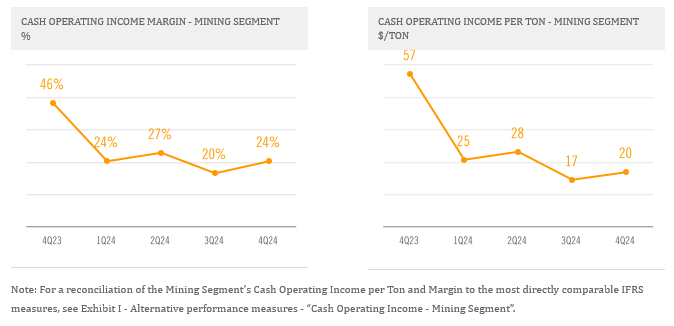
The Mining Segment's Cash Operating Income per Ton and Margin increased sequentially in the fourth quarter of 2024 due to lower operating costs, partially offset by a decrease in realized iron ore prices. The reduction in operating costs was partly attributed to a lower-priced mix of sales.
Mining Segment Full Year of 2024 Shipments and Net Sales
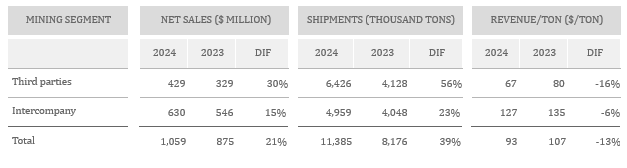
In 2024, the Mining Segment's net sales increased by 21% year-over-year, driven by a 39% increase in the Mining Segment's shipments partially offset by a 13% decline in realized iron ore prices. The year-over-year increase in the Mining Segment's shipments primarily reflected the full year consolidation of Usiminas' results, partially offset by lower production levels in our Mexican and Brazilian operations.
Net Financial Results
Net financial results showed a loss of $67 million in the fourth quarter of 2024. In this period, Ternium reported a $72 million net foreign exchange loss, primarily due to the adverse effect of the Brazilian Real's depreciation against the US dollar on Usiminas' US dollar denominated liabilities, given that Usiminas uses the Brazilian Real as its functional currency.
For the full year 2024, net financial results showed a loss of $194 million, including the negative impact of the Brazilian Real's depreciation on Usiminas' US dollar denominated liabilities. Additionally, net financial results for 2024 reflected a loss of $121 million due to Ternium's divestment of Argentine government bond holdings, resulting in the recycling of changes in the fair value of financial instruments from Other Comprehensive Income to Financial Results.
$ MILLION |
| 4Q24 |
|
| 3Q24 |
|
| 4Q23 |
|
| 2024 |
|
| 2023 |
|
|
|
|
|
|
|
|
|
|
|
|
|
|
|
| |
Net interest results |
| 18 |
|
| 17 |
|
| 49 |
|
| 102 |
|
| 130 |
|
Net foreign exchange result |
| (72 | ) |
| 57 |
|
| 171 |
|
| (104 | ) |
| 98 |
|
Change in fair value of financial assets |
| (3 | ) |
| 11 |
|
| (85 | ) |
| (133 | ) |
| (58 | ) |
Other financial expense, net |
| (11 | ) |
| (11 | ) |
| (32 | ) |
| (58 | ) |
| (46 | ) |
Net financial results |
| (67 | ) |
| 74 |
|
| 103 |
|
| (194 | ) |
| 123 |
|
Income Tax Results
Ternium Mexico, Ternium Argentina and Ternium Brasil use the US dollar as their functional currency and are, therefore, affected by deferred tax results. These results account for the impact of local currency fluctuations against the US dollar, as well as for the effect of local inflation. In addition, in the fourth quarter of 2024 the effective tax rate was influenced by a provision reversal for ongoing litigation related to the acquisition of a participation in Usiminas; for the full year 2024 it was influenced by a net provision related to the same litigation; and for the full year 2023 it was influenced by certain non-cash effects related to the increase in the participation in Usiminas.
$ MILLION |
| 4Q24 |
|
| 3Q24 |
|
| 4Q23 |
|
| 2024 |
|
| 2023 |
|
|
|
|
|
|
|
|
|
|
|
|
|
|
|
| |
Current income tax expense |
| (10 | ) |
| (63 | ) |
| (141 | ) |
| (323 | ) |
| (591 | ) |
Deferred tax (loss) gain |
| (54 | ) |
| (80 | ) |
| (15 | ) |
| (231 | ) |
| 257 |
|
Income tax expense |
| (64 | ) |
| (143 | ) |
| (156 | ) |
| (554 | ) |
| (334 | ) |
Result before income tax |
| 397 |
|
| 236 |
|
| 709 |
|
| 728 |
|
| 1,321 |
|
Effective tax rate |
| 16 | % |
| 61 | % |
| 22 | % |
| 76 | % |
| 25 | % |
|
|
|
|
|
|
|
|
|
|
|
|
|
|
| |
Excluding provision (reversal) charge for ongoing litigation related to the acquisition of a participation in Usiminas in 2012 |
| (404 | ) |
| 31 |
|
| - |
|
| 410 |
|
| - |
|
Excluding non-cash effects in the 3Q23 related to the increase in the participation in Usiminas |
| - |
|
| - |
|
| - |
|
| - |
|
| 1,106 |
|
Result before income tax excluding provision and non-cash effects |
| (7 | ) |
| 267 |
|
| 709 |
|
| 1,138 |
|
| 2,427 |
|
Effective tax rate excluding provision and non-cash effects |
| -936 | % |
| 54 | % |
| 22 | % |
| 49 | % |
| 14 | % |
Net Income
In the fourth quarter of 2024, Ternium recorded net income of $333 million, which included a provision reversal of $404 million for ongoing litigation related to the acquisition of a participation in Usiminas. Excluding this provision reversal, Adjusted Net Loss amounted to $71 million, with an operating income of $42 million and a financial result loss of $67 million.
Adjusted Equity Holder's Net Loss was $83 million in the fourth quarter, or $0.42 per ADS, mainly after accounting for the participation of a 76.7% non-controlling interest in Usiminas and a 37.4% non-controlling interest in Ternium Argentina.
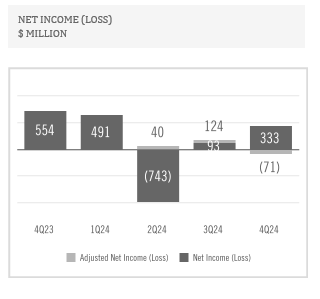
For the full year 2024, net income was $174 million, which included a net provision of $410 million for ongoing litigation related to the acquisition of a participation in Usiminas. Excluding this provision, Adjusted Net Income amounted to $584 million, with an operating income of $1.3 billion, deferred tax losses of $231 million and a financial result loss of $194 million.
Adjusted Equity Holder's Net Income was $316 million in 2024, or $1.61 per ADS.
$ MILLION |
| 4Q24 |
|
| 3Q24 |
|
| 4Q23 |
|
| 2024 |
|
| 2023 |
|
|
|
|
|
|
|
|
|
|
|
|
|
|
|
| |
Owners of the parent |
| 281 |
|
| 32 |
|
| 414 |
|
| (54 | ) |
| 676 |
|
Non-controlling interest |
| 52 |
|
| 61 |
|
| 140 |
|
| 227 |
|
| 310 |
|
Net Income |
| 333 |
|
| 93 |
|
| 554 |
|
| 174 |
|
| 986 |
|
|
|
|
|
|
|
|
|
|
|
|
|
|
|
| |
Excluding provision (reversal) charge for ongoing litigation related to the acquisition of a participation in Usiminas in 2012 |
| (404 | ) |
| 31 |
|
| - |
|
| 410 |
|
| - |
|
Excluding non-cash effects in the 3Q23 related to the increase in the participation in Usiminas |
| - |
|
| - |
|
| - |
|
| - |
|
| 1,106 |
|
Adjusted Net (Loss) Income |
| (71 | ) |
| 124 |
|
| 554 |
|
| 584 |
|
| 2,092 |
|
$ per ADS |
| 4Q24 |
|
| 3Q24 |
|
| 4Q23 |
|
| 2024 |
|
| 2023 |
|
Earnings (Losses) per ADS |
| 1.43 |
|
| 0.16 |
|
| 2.11 |
|
| (0.27 | ) |
| 3.44 |
|
Adjusted (Losses) Earnings per ADS |
| (0.42 | ) |
| 0.30 |
|
| 2.11 |
|
| 1.61 |
|
| 8.59 |
|
Cash Flow and Liquidity
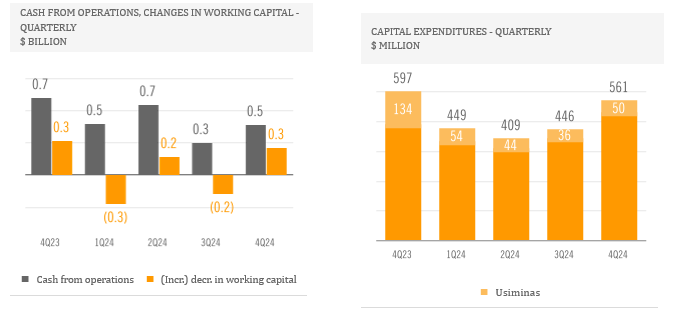
In the fourth quarter of 2024, cash from operations amounted to $472 million, with a $257 million decrease in working capital. This decrease included a $194 million net reduction in trade and other receivables, mainly due to lower net sales. In addition, inventories decreased by $113 million during the period, primarily due to lower inventory costs, partially offset by higher steel volumes. Conversely, trade payables and other liabilities saw a net decrease of $49 million in the fourth quarter. Capital expenditures totaled $561 million, primarily reflecting progress in the construction of the new facilities at Ternium's industrial center in Pesquería, Mexico, as well as the completion of the new wind farm in Argentina.
In 2024, cash from operations reached $1.9 billion, with working capital remaining relatively unchanged year-over-year. Inventories increased by $109 million, as higher steel and raw material inventory volumes were partially offset by lower inventory costs. In addition, trade payables and other liabilities recorded a net decrease of $35 million in 2024. On the other hand, trade and other receivables saw a net decrease of $128 million amid lower realized steel prices.
Capital expenditures amounted to $1.9 billion in 2024. Throughout the year, the company advanced the construction of the new downstream and upstream facilities in its industrial center in Pesquería, Mexico, including the start-up of a new push-pull pickling line and finishing facilities and built a new wind farm in Argentina. Furthermore, the company advanced several projects aimed at further improving environmental and safety conditions throughout its main facilities.
In 2024, alongside the development of its capital expenditure program, Ternium paid dividends totaling $609 million to its shareholders and $54 million to the minority interest.
Despite these significant cash disbursements, Ternium maintained a robust Net Cash position of $1.6 billion as of year-end 2024. This was supported by the aforementioned cash generated from operating activities and a $457 million increase in the fair value of financial instruments.
Conference Call and Webcast
Ternium will host a conference call on February 19, 2025, at 8:30 a.m. ET in which management will discuss fourth quarter and full year 2024 results. A webcast link will be available in the Investor Center section of the company's website at www.ternium.com.
Forward Looking Statements
Some of the statements contained in this press release are "forward-looking statements". Forward-looking statements are based on management's current views and assumptions and involve known and unknown risks that could cause actual results, performance or events to differ materially from those expressed or implied by those statements. These risks include but are not limited to risks arising from uncertainties as to gross domestic product, related market demand, global production capacity, tariffs, cyclicality in the industries that purchase steel products, and other factors beyond Ternium's control.
About Ternium
Ternium is a leading steel producer in the Americas, providing advanced steel products to a wide range of manufacturing industries and the construction sector. We invest in low carbon emissions steelmaking technologies to support the energy transition and the mobility of the future. We also support the development of our communities, especially through educational programs in Latin America. More information about Ternium is available at www.ternium.com.
Income Statement
$ MILLION |
| 4Q24 |
|
| 3Q24 |
|
| 4Q23 |
|
| 2024 |
|
| 2023 |
|
|
|
|
|
|
|
|
|
|
|
|
|
|
|
| |
Net sales |
| 3,876 |
|
| 4,480 |
|
| 4,931 |
|
| 17,649 |
|
| 17,610 |
|
Cost of sales |
| (3,426 | ) |
| (3,902 | ) |
| (4,039 | ) |
| (14,760 | ) |
| (14,051 | ) |
Gross profit |
| 450 |
|
| 578 |
|
| 892 |
|
| 2,889 |
|
| 3,559 |
|
Selling, general and administrative expenses |
| (373 | ) |
| (412 | ) |
| (432 | ) |
| (1,651 | ) |
| (1,472 | ) |
Other operating (expense) income, net |
| (35 | ) |
| 9 |
|
| 121 |
|
| 25 |
|
| 110 |
|
Operating income |
| 42 |
|
| 175 |
|
| 582 |
|
| 1,263 |
|
| 2,198 |
|
|
|
|
|
|
|
|
|
|
|
|
|
|
|
| |
Financial expense |
| (52 | ) |
| (54 | ) |
| (44 | ) |
| (196 | ) |
| (125 | ) |
Financial income |
| 71 |
|
| 71 |
|
| 94 |
|
| 298 |
|
| 255 |
|
Other financial (expense) income, net |
| (86 | ) |
| 57 |
|
| 54 |
|
| (296 | ) |
| (6 | ) |
Equity in earnings of non-consolidated companies |
| 18 |
|
| 17 |
|
| 24 |
|
| 69 |
|
| 105 |
|
Effect related to the increase of the participation in Usiminas |
| - |
|
| - |
|
| - |
|
| - |
|
| (171 | ) |
Recycling of other comprehensive income related to Usiminas |
| - |
|
| - |
|
| - |
|
| - |
|
| (935 | ) |
Provision reversal (charge) for ongoing litigation related to the acquisition of a participation in Usiminas |
| 404 |
|
| (31 | ) |
| - |
|
| (410 | ) |
| - |
|
Profit before income tax results |
| 397 |
|
| 236 |
|
| 709 |
|
| 728 |
|
| 1,321 |
|
Income tax expense |
| (64 | ) |
| (143 | ) |
| (156 | ) |
| (554 | ) |
| (334 | ) |
Profit for the period |
| 333 |
|
| 93 |
|
| 554 |
|
| 174 |
|
| 986 |
|
|
|
|
|
|
|
|
|
|
|
|
|
|
|
| |
Attributable to: |
|
|
|
|
|
|
|
|
|
|
|
|
|
|
|
Owners of the parent |
| 281 |
|
| 32 |
|
| 414 |
|
| (54 | ) |
| 676 |
|
Non-controlling interest |
| 52 |
|
| 61 |
|
| 140 |
|
| 227 |
|
| 310 |
|
Profit for the period |
| 333 |
|
| 93 |
|
| 554 |
|
| 174 |
|
| 986 |
|
Statement of Financial Position
$ MILLION |
| DECEMBER 31, 2024 |
|
| DECEMBER 31, 2023 |
| ||
|
|
|
|
|
| |||
Property, plant and equipment, net |
|
| 8,381 |
|
|
| 7,638 |
|
Intangible assets, net |
|
| 1,022 |
|
|
| 996 |
|
Investments in non-consolidated companies |
|
| 469 |
|
|
| 517 |
|
Other investments |
|
| 23 |
|
|
| 211 |
|
Deferred tax assets |
|
| 1,194 |
|
|
| 1,713 |
|
Receivables, net |
|
| 961 |
|
|
| 1,073 |
|
Total non-current assets |
|
| 12,050 |
|
|
| 12,149 |
|
|
|
|
|
|
|
|
| |
Receivables, net |
|
| 902 |
|
|
| 1,173 |
|
Derivative financial instruments |
|
| 4 |
|
|
| 15 |
|
Inventories, net |
|
| 4,751 |
|
|
| 4,948 |
|
Trade receivables, net |
|
| 1,562 |
|
|
| 2,065 |
|
Other investments |
|
| 2,160 |
|
|
| 1,976 |
|
Cash and cash equivalents |
|
| 1,691 |
|
|
| 1,846 |
|
Total current assets |
|
| 11,071 |
|
|
| 12,024 |
|
|
|
|
|
|
|
|
| |
Non-current assets classified as held for sale |
|
| 7 |
|
|
| 7 |
|
|
|
|
|
|
|
|
| |
Total assets |
|
| 23,129 |
|
|
| 24,179 |
|
Statement of Financial Position (cont.)
$ MILLION |
| DECEMBER 31, 2024 |
|
| DECEMBER 31, 2023 |
| ||
|
|
|
|
|
| |||
Capital and reserves attributable to the owners of the parent |
|
| 11,968 |
|
|
| 12,419 |
|
Non-controlling interest |
|
| 4,163 |
|
|
| 4,393 |
|
Total equity |
|
| 16,132 |
|
|
| 16,812 |
|
|
|
|
|
|
|
|
| |
Provisions |
|
| 553 |
|
|
| 840 |
|
Deferred tax liabilities |
|
| 89 |
|
|
| 171 |
|
Non current tax liabilities |
|
| 21 |
|
|
| - |
|
Other liabilities |
|
| 766 |
|
|
| 1,149 |
|
Trade payables |
|
| 5 |
|
|
| 12 |
|
Lease liabilities |
|
| 164 |
|
|
| 189 |
|
Borrowings |
|
| 1,560 |
|
|
| 1,206 |
|
Total non-current liabilities |
|
| 3,158 |
|
|
| 3,567 |
|
|
|
|
|
|
|
|
| |
Provision for ongoing litigation related to the acquisition of a participation in Usiminas |
|
| 410 |
|
|
| - |
|
Current income tax liabilities |
|
| 107 |
|
|
| 137 |
|
Other liabilities |
|
| 630 |
|
|
| 430 |
|
Trade payables |
|
| 1,926 |
|
|
| 2,233 |
|
Derivative financial instruments |
|
| 50 |
|
|
| 8 |
|
Lease liabilities |
|
| 46 |
|
|
| 52 |
|
Borrowings |
|
| 670 |
|
|
| 940 |
|
Total current liabilities |
|
| 3,839 |
|
|
| 3,801 |
|
|
|
|
|
|
|
|
| |
Total liabilities |
|
| 6,997 |
|
|
| 7,367 |
|
|
|
|
|
|
|
|
| |
Total equity and liabilities |
|
| 23,129 |
|
|
| 24,179 |
|
Statement of Cash Flows
$ MILLION |
| 4Q24 |
|
| 3Q24 |
|
| 4Q23 |
|
| 2024 |
|
| 2023 |
|
|
|
|
|
|
|
|
|
|
|
|
|
|
|
| |
Result for the period |
| 333 |
|
| 93 |
|
| 554 |
|
| 174 |
|
| 986 |
|
|
|
|
|
|
|
|
|
|
|
|
|
|
|
| |
Adjustments for: |
|
|
|
|
|
|
|
|
|
|
|
|
|
|
|
Depreciation and amortization |
| 189 |
|
| 184 |
|
| 191 |
|
| 743 |
|
| 658 |
|
Income tax accruals less payments |
| 23 |
|
| 204 |
|
| (45 | ) |
| 498 |
|
| (161 | ) |
Equity in earnings of non-consolidated companies |
| (18 | ) |
| (17 | ) |
| (24 | ) |
| (69 | ) |
| (105 | ) |
Provision (reversal) charge for ongoing litigation related to the acquisition of a participation in Usiminas |
| (404 | ) |
| 31 |
|
| - |
|
| 410 |
|
| - |
|
Interest accruals less payments / receipts, net |
| (7 | ) |
| 3 |
|
| (34 | ) |
| (16 | ) |
| (45 | ) |
Changes in provisions |
| 10 |
|
| (1 | ) |
| (61 | ) |
| (60 | ) |
| (64 | ) |
Changes in working capital |
| 257 |
|
| (176 | ) |
| 320 |
|
| (16 | ) |
| 321 |
|
Net foreign exchange results and others |
| 56 |
|
| (17 | ) |
| (225 | ) |
| 211 |
|
| (236 | ) |
Impairment of Las Encinas' mining assets |
| 32 |
|
| - |
|
| 42 |
|
| 32 |
|
| 42 |
|
Non-cash effects related to the increase of the participation in Usiminas |
| - |
|
| - |
|
| - |
|
| - |
|
| 1,106 |
|
Net cash provided by operating activities |
| 472 |
|
| 303 |
|
| 718 |
|
| 1,906 |
|
| 2,501 |
|
|
|
|
|
|
|
|
|
|
|
|
|
|
|
| |
Capital expenditures and advances to suppliers for PP&E |
| (561 | ) |
| (446 | ) |
| (597 | ) |
| (1,865 | ) |
| (1,461 | ) |
Decrease (increase) in other investments |
| 296 |
|
| (164 | ) |
| 129 |
|
| 462 |
|
| (718 | ) |
Proceeds from the sale of property, plant & equipment |
| 1 |
|
| 0 |
|
| 1 |
|
| 2 |
|
| 2 |
|
Dividends received from non-consolidated companies |
| 21 |
|
| 3 |
|
| 28 |
|
| 26 |
|
| 43 |
|
Acquisition of business: |
|
|
|
|
|
|
|
|
|
|
|
|
|
|
|
Purchase consideration |
| - |
|
| - |
|
| - |
|
| - |
|
| (119 | ) |
Cash acquired |
| - |
|
| - |
|
| - |
|
| - |
|
| 781 |
|
Net cash used in investing activities |
| (243 | ) |
| (606 | ) |
| (439 | ) |
| (1,375 | ) |
| (1,470 | ) |
|
|
|
|
|
|
|
|
|
|
|
|
|
|
| |
Dividends paid in cash to company's shareholders |
| (177 | ) |
| - |
|
| (216 | ) |
| (609 | ) |
| (569 | ) |
Dividends paid in cash to non-controlling interest |
| (5 | ) |
| (3 | ) |
| - |
|
| (54 | ) |
| - |
|
Finance lease payments |
| (15 | ) |
| (13 | ) |
| (16 | ) |
| (61 | ) |
| (59 | ) |
Proceeds from borrowings |
| 272 |
|
| 852 |
|
| 119 |
|
| 1,559 |
|
| 355 |
|
Repayments of borrowings |
| (139 | ) |
| (652 | ) |
| (121 | ) |
| (1,323 | ) |
| (493 | ) |
Net cash (used in) provided by financing activities |
| (63 | ) |
| 183 |
|
| (234 | ) |
| (488 | ) |
| (766 | ) |
|
|
|
|
|
|
|
|
|
|
|
|
|
|
| |
Increase (decrease) in cash and cash equivalents |
| 165 |
|
| (121 | ) |
| 45 |
|
| 42 |
|
| 264 |
|
Exhibit I - Alternative Performance Measures
These non-IFRS measures should not be considered in isolation of, or as a substitute for, measures of performance prepared in accordance with IFRS. These non-IFRS measures do not have a standardized meaning under IFRS and, therefore, may not correspond to similar non-IFRS financial measures reported by other companies.
Adjusted EBITDA
$ MILLION |
| 4Q24 |
|
| 3Q24 |
|
| 4Q23 |
|
| 2024 |
|
| 2023 |
|
|
|
|
|
|
|
|
|
|
|
|
|
|
|
| |
Net income |
| 333 |
|
| 93 |
|
| 554 |
|
| 174 |
|
| 986 |
|
Adjusted to exclude: |
|
|
|
|
|
|
|
|
|
|
|
|
|
|
|
Depreciation and amortization |
| 189 |
|
| 184 |
|
| 191 |
|
| 743 |
|
| 658 |
|
Income tax results |
| 64 |
|
| 143 |
|
| 156 |
|
| 554 |
|
| 334 |
|
Net financial results |
| 67 |
|
| (74 | ) |
| (103 | ) |
| 194 |
|
| (123 | ) |
Equity in earnings of non-consolidated companies |
| (18 | ) |
| (17 | ) |
| (24 | ) |
| (69 | ) |
| (105 | ) |
Provision (reversal) charge for ongoing litigation related to the acquisition of a participation in Usiminas |
| (404 | ) |
| 31 |
|
| - |
|
| 410 |
|
| - |
|
Impairment of Las Encinas' mining assets |
| 32 |
|
| - |
|
| 42 |
|
| 32 |
|
| 42 |
|
Reversal of other Usiminas contingencies recognized as part of the PPA |
| - |
|
| - |
|
| (63 | ) |
| (34 | ) |
| (63 | ) |
Non-cash effects related to the increase in the participation in Usiminas |
| - |
|
| - |
|
| - |
|
| - |
|
| 1,106 |
|
Reversal of Usiminas' post-retirement liabilities |
| - |
|
| - |
|
| (109 | ) |
| - |
|
| (109 | ) |
Adjusted to include: |
|
|
|
|
|
|
|
|
|
|
|
|
|
|
|
Proportional EBITDA in Unigal (70% participation) |
| 6 |
|
| 8 |
|
| 8 |
|
| 33 |
|
| 14 |
|
Adjusted EBITDA |
| 270 |
|
| 368 |
|
| 651 |
|
| 2,038 |
|
| 2,740 |
|
Divided by: net sales |
| 3,876 |
|
| 4,480 |
|
| 4,931 |
|
| 17,649 |
|
| 17,610 |
|
Adjusted EBITDA Margin (%) |
| 7 | % |
| 8 | % |
| 13 | % |
| 12 | % |
| 16 | % |
Exhibit I - Alternative Performance Measures (cont.)
Cash Operating Income - Steel Segment
$ MILLION |
| 4Q24 |
|
| 3Q24 |
|
| 4Q23 |
|
| 2024 |
|
| 2023 |
|
|
|
|
|
|
|
|
|
|
|
|
|
|
|
| |
Operating Income - Management View (Note "Segment Information" to Ternium's Financial Statements as of the corresponding dates) |
| 308 |
|
| 381 |
|
| 606 |
|
| 1,560 |
|
| 2,391 |
|
Plus/Minus differences in cost of sales (IFRS) |
| (259 | ) |
| (219 | ) |
| (138 | ) |
| (330 | ) |
| (296 | ) |
Excluding depreciation and amortization |
| 142 |
|
| 138 |
|
| 154 |
|
| 552 |
|
| 542 |
|
Excluding reversal of other Usiminas contingencies |
| - |
|
| - |
|
| (63 | ) |
| (34 | ) |
| (63 | ) |
Excluding reversal of Usiminas' post-retirement liabilities |
| - |
|
| - |
|
| (109 | ) |
| - |
|
| (109 | ) |
Including proportional EBITDA in Unigal (70% participation) |
| 6 |
|
| 8 |
|
| 8 |
|
| 33 |
|
| 14 |
|
Cash Operating Income |
| 197 |
|
| 309 |
|
| 458 |
|
| 1,780 |
|
| 2,479 |
|
Divided by steel shipments (thousand tons) |
| 3,764 |
|
| 4,123 |
|
| 4,035 |
|
| 15,622 |
|
| 14,213 |
|
Cash Operating Income per Ton - Steel |
| 52 |
|
| 75 |
|
| 113 |
|
| 114 |
|
| 174 |
|
Divided by steel net sales |
| 3,767 |
|
| 4,368 |
|
| 4,750 |
|
| 17,220 |
|
| 17,281 |
|
Cash Operating Income Margin - Steel (%) |
| 5 | % |
| 7 | % |
| 10 | % |
| 10 | % |
| 14 | % |
Cash Operating Income - Mining Segment
$ MILLION |
| 4Q24 |
|
| 3Q24 |
|
| 4Q23 |
|
| 2024 |
|
| 2023 |
|
|
|
|
|
|
|
|
|
|
|
|
|
|
|
| |
Operating Result - Management View (Note "Segment Information" to Ternium's Financial Statements as of the corresponding dates) |
| (35 | ) |
| (58 | ) |
| 51 |
|
| (166 | ) |
| 16 |
|
Plus/minus differences in cost of sales (IFRS) |
| 15 |
|
| 64 |
|
| 55 |
|
| 194 |
|
| 66 |
|
Excluding depreciation and amortization |
| 47 |
|
| 46 |
|
| 37 |
|
| 192 |
|
| 115 |
|
Impairment of Las Encinas' mining assets |
| 32 |
|
| - |
|
| 42 |
|
| 32 |
|
| 42 |
|
Cash Operating Income |
| 60 |
|
| 52 |
|
| 185 |
|
| 252 |
|
| 239 |
|
Divided by mining shipments (thousand tons) |
| 2,995 |
|
| 3,020 |
|
| 3,277 |
|
| 11,385 |
|
| 8,176 |
|
Cash Operating Income per Ton - Mining |
| 20 |
|
| 17 |
|
| 57 |
|
| 22 |
|
| 29 |
|
Divided by mining net sales |
| 249 |
|
| 264 |
|
| 404 |
|
| 1,059 |
|
| 875 |
|
Cash Operating Income Margin - Mining (%) |
| 24 | % |
| 20 | % |
| 46 | % |
| 24 | % |
| 27 | % |
|
|
|
|
|
|
|
|
|
|
|
|
|
|
|
Exhibit I - Alternative Performance Measures (cont.)
Adjusted Net Income
$ MILLION |
| 4Q24 |
|
| 3Q24 |
|
| 4Q23 |
|
| 2024 |
|
| 2023 |
|
|
|
|
|
|
|
|
|
|
|
|
|
|
|
| |
Net income |
| 333 |
|
| 93 |
|
| 554 |
|
| 174 |
|
| 986 |
|
Excluding provision (reversal) charge for ongoing litigation related to the acquisition of a participation in Usiminas |
| (404 | ) |
| 31 |
|
| - |
|
| 410 |
|
| - |
|
Excluding non-cash effects in the 3Q23 related to the increase in the participation in Usiminas |
| - |
|
| - |
|
| - |
|
| - |
|
| 1,106 |
|
Adjusted Net Income (Loss) |
| (71 | ) |
| 124 |
|
| 554 |
|
| 584 |
|
| 2,092 |
|
Note: In the press release announcing third quarter of 2024 results, reported third quarter of 2024 Adjusted Net Income did not exclude the provision charge for ongoing litigation related to the acquisition of a participation in Usiminas. To enhance comparability, in this press release the mentioned provision was excluded in all reported periods.
Adjusted Equity Holders' Net Income and Adjusted Earnings per ADS
$ MILLION |
| 4Q24 |
|
| 3Q24 |
|
| 4Q23 |
|
| 2024 |
|
| 2023 |
|
|
|
|
|
|
|
|
|
|
|
|
|
|
|
| |
Equity holders' net income (loss) |
| 281 |
|
| 32 |
|
| 414 |
|
| (54 | ) |
| 676 |
|
Excluding provision (reversal) charge for ongoing litigation related to the acquisition of a participation in Usiminas |
| (364 | ) |
| 28 |
|
| - |
|
| 370 |
|
| - |
|
Excluding non-cash effects in the 3Q23 related to the increase in the participation in Usiminas |
| - |
|
| - |
|
| - |
|
| - |
|
| 1,010 |
|
Adjusted Equity Holders' Net (Loss) Income |
| (83 | ) |
| 60 |
|
| 414 |
|
| 316 |
|
| 1,686 |
|
Divided by: outstanding shares of common stock, net of treasury shares (expressed in million of ADS equivalent) |
| 196 |
|
| 196 |
|
| 196 |
|
| 196 |
|
| 196 |
|
Adjusted (Losses) Earnings per ADS ($) |
| (0.42 | ) |
| 0.30 |
|
| 2.11 |
|
| 1.61 |
|
| 8.59 |
|
Free Cash Flow
$ MILLION |
| 4Q24 |
|
| 3Q24 |
|
| 4Q23 |
|
| 2024 |
|
| 2023 |
|
|
|
|
|
|
|
|
|
|
|
|
|
|
|
| |
Net cash provided by operating activities |
| 472 |
|
| 303 |
|
| 718 |
|
| 1,906 |
|
| 2,501 |
|
Excluding capital expenditures and advances to suppliers for PP&E |
| (561 | ) |
| (446 | ) |
| (597 | ) |
| (1,865 | ) |
| (1,461 | ) |
Free Cash Flow |
| (90 | ) |
| (143 | ) |
| 121 |
|
| 41 |
|
| 1,040 |
|
Exhibit I - Alternative Performance Measures (cont.)
Net Cash
$ BILLION |
| DECEMBER 31, 2024 |
|
| SEPTEMBER 30, 2024 |
|
| DECEMBER 31, 2023 |
| |||
|
|
|
|
|
|
|
|
| ||||
Cash and cash equivalents |
|
| 1.7 |
|
|
| 1.6 |
|
|
| 1.8 |
|
Plus: other investments (current and non-current) |
|
| 2.2 |
|
|
| 2.3 |
|
|
| 2.2 |
|
Less: borrowings (current and non-current) |
|
| (2.2 | ) |
|
| (2.2 | ) |
|
| (2.1 | ) |
Net Cash |
|
| 1.6 |
|
|
| 1.7 |
|
|
| 1.9 |
|
Note: Ternium Argentina's consolidated position of cash and cash equivalents and other investments amounted to $1.3 billion as of December 31, 2024, $1.2 billion as of September 30, 2024, and $1.1 billion as of December 31, 2023.
Contact:
Sebastián Martí
Ternium - Investor Relations
+1 (866) 890 0443
+54 (11) 4018 8389
www.ternium.com
SOURCE: Ternium S.A.
